Opens in a new tab
Join Anantam IAS Channel on Telegram

Daily Digest · Wednesday

7 October 2026 Current Affairs for UPSC

12 current affairs published on Wednesday, 7 October 2026

7 October 2026 Current Affairs for UPSC — every Why-in-News article AnantamIAS published on Wednesday, 7 October 2026, broken down with Why in News?, the exact GS paper it feeds, sub-topic mapping, MCQ-ready facts and a UPSC-style practice question. 12 articles in total, covering Polity, Economy, Environment, S&T, IR, Geography, History, Society and Internal Security — the same Why-in-News + GS-paper-mapping + practice-question format the Compass uses across every daily digest on the site.

Daily current affairs for UPSC is where new material enters your prep stream. Read this 7 October 2026 digest end-to-end in 25–35 minutes, attempt the practice question at the foot of each article (it's MCQ for some, 10/15-marker for others), then bookmark the entries that fall inside your active revision window. Everything stays cross-linked: tap any subject pill to jump to that subject's hub, or use the table of contents above to skip straight to a specific story.

Use this page three ways. Read sequentially for a one-sitting scan of everything that mattered on 7 October 2026. Download the 7 October 2026 PDF below for offline study or print revision. Or use the October 2026 Current Affairs compilation to see this day in the month's full context. For the previous day's reading, see 6 October 2026 Current Affairs; the next day's is 8 October 2026 Current Affairs.

Why we publish daily current affairs separately from the monthly compilation: daily is learning, monthly is revision. Use the daily page to add fresh material to your notes the day it breaks; come back to the October 2026 compilation 60 days before Prelims when the noise has settled and only the lasting takeaway is worth re-reading.

Industrial Fuel Cameras: Linking Visual Checks With Emission Data

Open article →Download PDF

Why in News?

On 6 October 2026, CAQM announced expanded camera coverage of industrial fuel use in NCR, requiring additional installations by 31 October.

  • PTZ cameras must cover all fuel-storage areas and charging points; gas-based units must bring the gas gauge or meter into view.
  • Live feeds must reach CPCB and the respective State Pollution Control Boards or Delhi Pollution Control Committee.
  • Industries must provide power backup for cameras and connectivity; regulators must establish infrastructure to receive the streams.
  • The order follows inspection findings of unapproved fuels; its installation deadline does not establish that every unit already complies.
  • Fuel restrictions are difficult to enforce when an inspector sees only a brief part of a factory’s operating cycle.
  • Visual evidence and emission measurements answer different questions; using both can make suspected violations easier to investigate.

UPSC Relevance

Prelims Relevance

  • PTZ: pan, tilt and zoom camera functions.
  • CAQM: Commission for Air Quality Management in NCR and Adjoining Areas.
  • CPCB, State Pollution Control Boards and DPCC: recipients of the required video feeds.
  • OCEMS: Online Continuous Emission Monitoring Systems.
  • Fuel-use footage does not directly measure pollutant concentrations.

Mains Relevance

GS Paper 3

  • Industrial air-pollution control through input checks and emissions monitoring.
  • Limits of remote environmental surveillance and the continuing need for inspections.

GS Paper 2

  • Coordination between a regional commission and pollution-control regulators.

Essay

  • Technology strengthens accountability only when evidence leads to action.

Background and Context

What the Additional Cameras Must Show

The new coverage follows the fuel through the industrial premises, making storage and use visible alongside existing monitoring locations.

  • CAQM already prescribed an approved-fuel list for different NCR applications, including industries. Its flying squads nevertheless found unapproved fuels during inspections, exposing a gap between a rule and actual practice.
  • Storage-area coverage helps show what material is kept on site and how it moves. A camera view provides an observation to investigate, rather than a laboratory identification of the fuel’s composition.
  • Charging-point coverage brings the place where fuel enters equipment into view. This matters because looking only at stored material cannot establish which material is actually fed during a particular operating period.
  • For gas-based fuel, the order requires the gauge or meter to be captured. Reading that instrument visually is different from treating the camera itself as a sensor that measures gas flow.
  • Backup power is required for both cameras and connectivity. A working camera alone cannot support continuous remote oversight if the network connection fails and regulators cannot receive the live feed.

How Cameras Complement Stack-Emission Monitoring

The central distinction is between seeing industrial activity and measuring emissions from that activity; neither evidence stream makes the other redundant.

  • OCEMS supplies continuous measurements of monitored emission parameters. A PTZ camera supplies images of selected locations; movement and zoom improve visibility but do not convert footage into a chemical measurement.
  • CPCB’s earlier arrangements already paired PTZ cameras with OCEMS. In specified boiler-using textile and food-processing units, camera locations included the monitoring port-hole and the flue-gas discharge from the stack.
  • For metal units, the release identifies fume-extraction and furnace-feeding areas among earlier camera locations. The new fuel-area coverage adds another view of operations instead of replacing those existing observation points.
  • A useful evidence comparison asks what was fed into equipment and what the stack monitor recorded. Matching observations in time can guide an inspection; it does not automatically establish causation or liability.
  • Visible smoke may prompt attention, but appearance alone cannot establish pollutant concentrations or compliance with an emission limit. Conversely, an apparently clear plume cannot prove that all relevant emissions are acceptable.
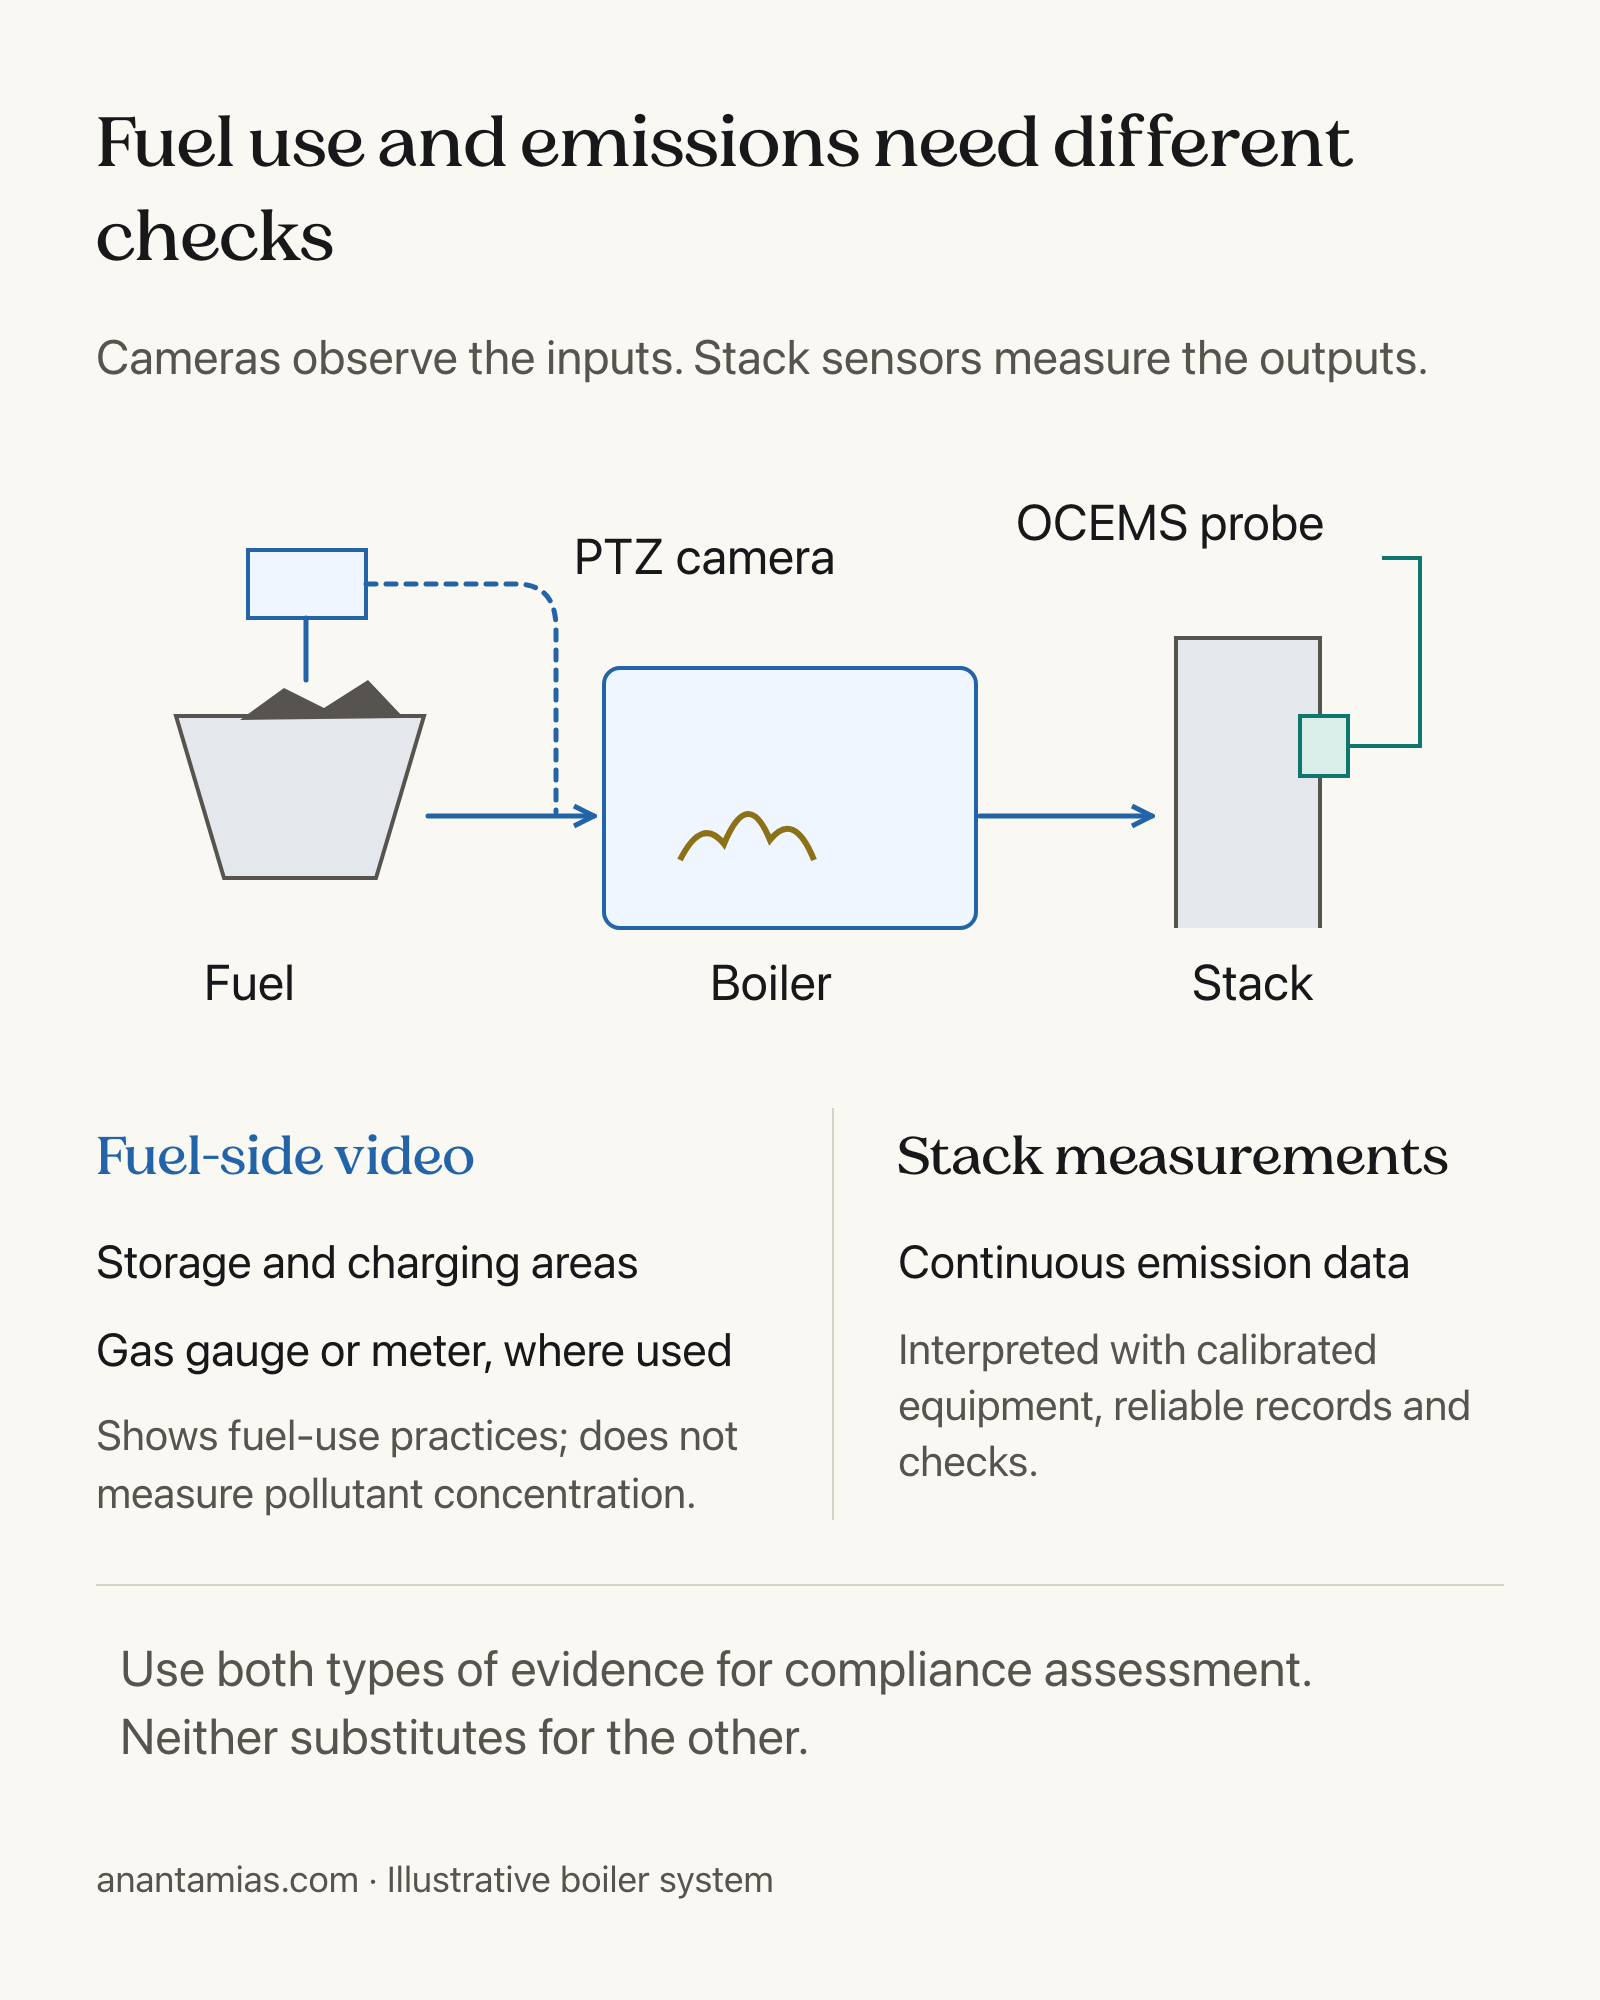
Fuel-side camera observations and stack-emission measurements in an illustrative boiler system
Cameras observe fuel-use locations, while OCEMS provides emission measurements; the two evidence streams support different compliance questions.

Where Remote Compliance Checks Can Fall Short

The order creates a monitoring obligation; its environmental value depends on usable evidence, regulatory follow-through and verified operation at the industrial unit.

  • Remote access can widen oversight beyond occasional visits, yet a live feed is useful only when the required area remains visible. An obstructed lens or poor angle can leave activity unexplained.
  • Regulatory responsibility is shared: industries provide coverage and backup, while CPCB and state boards or DPCC provide receiving infrastructure. Installation alone does not demonstrate that this entire chain works reliably.
  • Inspections remain necessary when footage suggests a breach or measurements need checking. Cameras can help select questions and locations for examination without establishing that every suspected violation has already been proved.
  • Data reliability needs attention alongside hardware. As an implementation safeguard, regulators should reconcile periods of missing footage with equipment operation before interpreting the remaining record as continuous evidence of compliance.
  • The official release announces expanded monitoring, not measured pollution reductions. For an answer, distinguish a mandated compliance mechanism from evidence that fuel practices or ambient air quality have improved.

Way Forward

Make the Evidence Usable

  • Check camera coverage and stream availability at the actual storage, charging and gas-meter locations before recording an installation as functional.
  • Use time-matched footage and emissions records to prioritize inspections, while treating unexplained gaps as questions requiring investigation.
  • Assess success through verified fuel compliance and regulatory action, alongside reliable monitoring, rather than counting installed cameras alone.

Conclusion

  • Industrial fuel enforcement works best when observations of inputs are read alongside measurements of outputs and followed by inspection where the evidence requires it.
  • The exam takeaway is complementarity: cameras can reveal practices, OCEMS measures monitored emission parameters, and regulators must assess both before drawing a compliance conclusion.

UPSC Practice Questions

Prelims MCQ 1

With reference to the expanded industrial camera coverage announced by CAQM, consider the following statements:

  1. Cameras must capture fuel-storage areas and fuel-charging points.
  2. For gas-based fuel, the gas gauge or meter must be captured.
  3. PTZ camera footage directly measures pollutant concentrations in stack gases.

How many of the above statements are correct?

(a) Only one (b) Only two (c) All three (d) None

Answer: (b) Only two

Explanation:

The first two requirements appear in the order as reported by PIB. Cameras provide visual observations; pollutant measurements require emission-monitoring instruments.

Prelims MCQ 2

Which approach best combines industrial cameras with OCEMS for regulatory oversight?

(a) Use plume appearance as a substitute for emission measurements (b) Treat camera installation as proof that only approved fuels are used (c) Compare time-matched operational footage and emission records, then investigate anomalies (d) Discontinue physical inspections once live streaming begins

Answer: (c) Compare time-matched operational footage and emission records, then investigate anomalies

Explanation:

The two systems provide different evidence. Combining observations can guide investigation, while reliable measurements and inspections remain necessary.

UPSC Mains Questions

  1. Explain how monitoring industrial fuel inputs can complement stack-emission monitoring. Discuss the limits of camera-based enforcement. (150 words)
  2. Technology can improve environmental oversight without guaranteeing compliance. Examine this statement with reference to industrial fuel-use surveillance in NCR. (250 words)

Source: PIB, Ministry of Environment, Forest and Climate Change.

Frequently Asked Questions

What has CAQM changed in industrial camera monitoring?

CAQM has expanded coverage to fuel-storage areas, charging points and gas gauges or meters. The order also requires live feeds to regulators and backup power for cameras and connectivity.

Can PTZ cameras measure air-pollutant concentrations?

No. PTZ cameras provide visual observations of industrial activity and specified locations. Emission-monitoring instruments provide measurements of monitored pollutants or parameters; footage cannot replace those measurements or establish concentrations from plume appearance.

What is the role of OCEMS?

Online Continuous Emission Monitoring Systems provide continuous measurements of monitored emission parameters. Their readings can be considered alongside operational footage, helping regulators investigate possible links between fuel-use practices and stack emissions.

Does the order prove that industrial pollution has fallen?

No. The release announces monitoring requirements and explains their enforcement purpose. Demonstrating an improvement would require evidence of implementation, verified fuel-use compliance and appropriate pollution measurements after the measures operate.


High-Altitude Parachute: Controlling Descent in Thin Air

Open article →Download PDF

Why in News?

On 6 October 2026, the Ministry of Defence reported DRDO’s maiden live jump of the Advanced High-Altitude Parachute at Nyoma’s Mudh drop zone.

  • The jump altitude was 16,000 feet above mean sea level; the parachute deployed at 15,500 feet, while the drop zone stood at 13,700 feet.
  • ADRDE, Agra designed and developed AHAP as a static-line parachute system for mass drops of paratroopers; Ordnance Parachute Factory, Kanpur manufactured it.
  • The Ministry reported inspection by DGAQA and certification by CEMILAC, RCMA Kanpur, alongside the successful live jump.
  • The release highlights opening shock and descent rate as high-altitude challenges, but supplies no numerical descent speed or complete performance record.
  • Mountain terrain combines elevated landing areas with demanding atmospheric conditions; a parachute must provide controlled descent within the height actually available above the ground.
  • Test evidence should connect a demonstrated result to its conditions, keeping developmental success distinct from claims about every possible operational situation.

UPSC Relevance

Prelims Relevance

  • AHAP: Advanced High-Altitude Parachute, developed by ADRDE.
  • Static-line deployment and its distinction from manual free-fall activation.
  • Air density, aerodynamic drag and descent control.
  • Above mean sea level versus height above a landing site.
  • Nyoma (Mudh drop zone) as the location of the reported trial.

Mains Relevance

GS Paper 3

  • Indigenous defence technology adapted to high-altitude operating conditions.
  • Testing, certification and the limits of claims based on a single demonstrated trial.

Essay

  • Technical capability depends on how well systems meet real environmental constraints.

Background and Context

What Does a Static-Line Parachute Do?

AHAP is an aerial-delivery system for controlled human descent, with a deployment mechanism suited to organised paratrooper drops.

  • Static-line deployment uses a line attached to the aircraft to initiate parachute deployment as the jumper leaves. It does not depend on the jumper choosing when to pull a main-parachute release during free fall.
  • Mass-drop design concerns delivering multiple paratroopers through a coordinated operation. The announced purpose should not be mistaken for a claim that this particular maiden live jump demonstrated a complete large-scale troop deployment.
  • The canopy creates aerodynamic resistance, while suspension lines and the harness transfer forces to the jumper. Successful descent depends on the system working together rather than on the fabric alone.
  • Opening shock is the transient force associated with deployment and deceleration. It is a different engineering concern from the subsequent descent rate; a safe design must address both phases of the jump.
  • Indigenous development links design, manufacturing, inspection and certification. The release identifies these functions separately, showing that producing equipment and evaluating its suitability are related steps with different responsibilities and evidence needs.

Why Does Thin Air Complicate Descent?

A parachute relies on moving air to resist falling; the surrounding atmosphere changes the force available from a given configuration.

  • Air density generally decreases with altitude. For the same speed, reference area and drag coefficient, the NASA drag equation gives less aerodynamic drag at lower density, affecting parachute performance.
  • Descent speed tends to be higher in thinner air when other relevant conditions are unchanged. That physical tendency explains the design challenge; it does not establish AHAP’s actual descent speed in this trial.
  • Canopy area and shape influence drag, alongside air density and speed. Designers must assess their combined effect rather than assuming that altitude alone fixes the performance of every parachute carrying the same load.
  • Deployment dynamics concern the changing forces as a packed canopy opens. A steady drag relationship cannot, by itself, predict the full opening shock or certify that the system meets safety requirements.
  • Evidence limits matter when reading official performance language. The Ministry describes AHAP’s descent performance favourably, but an aspirant should not turn that description into an invented speed, comparative safety ranking or universal guarantee.

Sea-Level Altitude Is Not Height Above the Drop Zone

The reported heights share a sea-level reference; subtracting the landing-site elevation reveals the vertical separation relevant to the descent.

  • Above mean sea level, or AMSL, measures altitude against a common reference surface. It does not measure the distance between a jumper and the elevated terrain directly below or at the intended landing site.
  • The three reported levels describe separate stages: the jump at 16,000 feet AMSL, deployment at 15,500 feet AMSL and the Nyoma landing site at 13,700 feet above the same reference.
  • Jump-to-site separation follows by subtracting the landing elevation from the jump altitude. The same subtraction from deployment altitude gives the nominal vertical distance remaining after deployment; neither equals the full sea-level altitude.
  • Vertical separation is not a measurement of the exact flight path. Wind, lateral movement and terrain can affect the journey, so these reference heights alone cannot establish descent time or the distance actually travelled.
  • Trial interpretation must preserve its scope: the reported jump demonstrates performance under the stated test conditions. It does not prove unrestricted deployment across every weather condition, equipment load, aircraft or high-altitude landing area.
Schematic comparing the reported jump, deployment and elevated landing-zone heights above mean sea level
The reported deployment altitude minus the landing-site altitude gives a nominal vertical separation of 1,800 feet; the schematic is not to scale.

Way Forward

Match Capability Claims to Test Evidence

  • Evaluate opening forces and descent behaviour across authorised test conditions, documenting the loads and atmospheric circumstances needed to interpret each result.
  • Keep reference heights explicit in public explanations so sea-level altitude is not confused with available descent height or a measured flight-path length.
  • Connect manufacturing quality, inspection and user feedback with continued evaluation; avoid treating an encouraging maiden jump as a substitute for all subsequent evidence.

Conclusion

  • AHAP connects indigenous aerial delivery with a specific mountain-environment challenge: the parachute must manage deployment forces and descent in thinner air above an already elevated landing site.
  • The durable exam distinction is between altitude AMSL and height relative to the drop zone. Read the reported success alongside its stated conditions, without inventing a descent speed or claiming universal operational performance.

UPSC Practice Questions

Prelims MCQ 1

With reference to the Advanced High-Altitude Parachute trial at Nyoma, consider the following statements:

  1. AHAP is described as a static-line parachute system.
  2. The reported jump altitude above mean sea level is identical to the vertical distance above the drop zone.
  3. ADRDE designed and developed the system.

How many of the above statements are correct?

(a) Only one (b) Only two (c) All three (d) None

Answer: (b) Only two

Explanation:

Statements 1 and 3 are correct. The elevated drop zone must be subtracted from the AMSL altitude to obtain nominal vertical separation from that site.

Prelims MCQ 2

For a fixed reference area, speed and drag coefficient, what happens to aerodynamic drag when air density decreases?

(a) It decreases. (b) It increases automatically. (c) It remains unchanged in all cases. (d) It becomes independent of the surrounding air.

Answer: (a) It decreases.

Explanation:

The drag equation makes drag directly proportional to air density when the other stated quantities are unchanged. Actual parachute performance also depends on configuration and operating conditions.

UPSC Mains Questions

  1. Explain how atmospheric conditions and terrain elevation shape the engineering requirements of high-altitude parachute systems.
  2. How should a successful indigenous defence-technology trial be assessed without confusing demonstrated capability with unrestricted operational readiness?

Sources: PIB, Ministry of Defence and NASA Glenn Research Center, Drag Equation.

Frequently Asked Questions

What is AHAP?

AHAP is the Advanced High-Altitude Parachute, designed and developed by ADRDE for static-line mass drops of paratroopers. The Ministry of Defence reported its maiden live jump at Nyoma in October 2026.

Why is the reported jump altitude not the full descent height?

The jump altitude is measured above mean sea level, while the landing site is itself highly elevated. Subtracting the site elevation gives nominal vertical separation; it does not describe the exact flight path.

Why does lower air density matter for a parachute?

At otherwise unchanged speed, reference area and drag coefficient, lower air density produces less drag. Parachute performance must account for this relationship, alongside deployment dynamics and the system’s actual operating conditions.

Did the release specify AHAP’s descent speed?

No numerical descent speed is provided in the cited release. Its favourable performance description should not be converted into an invented rate, a comparative safety ranking or a guarantee for every operational condition.

High-Altitude Platform: Testing a Stratospheric Airship

Open article →Download PDF

Why in News?

On 6 October 2026, DRDO reported a successful experimental flight of its lighter-than-air High-Altitude Platform, including a commanded descent and recovery after a stratospheric flight.

  • The platform reached 21 km above mean sea level and remained at 20 km for more than 30 minutes.
  • The ground station received real-time video and vehicle parameters throughout the flight.
  • The onboard equipment included navigation instruments, cameras and altitude control; flight performance data was analysed after recovery.
  • The platform is being developed by ADRDE, Agra, as a long-endurance stratospheric aerial surveillance system.
  • The trial demonstrates a step in experimental flight performance, while sustained operational use remains a separate engineering challenge.
  • The term high-altitude platform must be read with the design description: this announcement concerns a lighter-than-air system, not a solar fixed-wing aircraft.

UPSC Relevance

Prelims Relevance

  • ADRDE is the DRDO establishment developing this platform.
  • The reported system is lighter than air.
  • AMSL means above mean sea level.
  • Buoyant lift depends on displaced air and the total system weight.
  • An atmospheric airship is not an orbiting satellite.

Mains Relevance

GS Paper 3

  • Indigenous aerospace technology and the path from trials to operational capability.
  • Surveillance platforms, airspace coordination and technological limits.

Essay

  • A scientific milestone gains meaning when its demonstrated results are separated from future ambitions.

Background and Context

How a Lighter-Than-Air Platform Stays Aloft

This platform uses an atmospheric flight principle; reaching a high altitude does not turn an airship into a satellite.

  • Buoyancy comes from displaced air. As NASA explains, upward lift must be considered against the weight of the entire system, including its envelope, lifting gas, instruments and other carried equipment.
  • Thin air makes the lifting problem important at high altitude. For a given displaced volume, lower surrounding air density means less displaced air mass; designers must balance envelope size against the mass being supported.
  • The payload is not weightless just because the platform is high above the ground. Adding cameras or control equipment changes the mass that must be supported, creating trade-offs between carried capability and flight design.
  • The release identifies a lighter-than-air system but does not specify its lifting gas. Naming a particular gas, envelope material or solar-power arrangement as a confirmed feature would go beyond the published evidence.
  • A satellite follows an orbit under gravity with sufficient forward motion, as explained by NASA. This atmospheric platform relies on lift instead; an altitude milestone does not demonstrate orbital flight capability.

What Navigation, Control and Ground Data Contribute

The trial tested a flying system with instruments and ground communication, rather than reporting only that an envelope reached a particular height.

  • The platform carried an inertial measurement unit and a GPS receiver among its instrumentation. These are parts of the navigation and measurement package, distinct from the cameras carried to acquire visual information during flight.
  • An altitude control mechanism was among the reported subsystems. The platform was commanded to descend and recovered; this should not be expanded into an unsupported claim about autonomous station-keeping in all stratospheric wind conditions.
  • The Ground Control Station received real-time video and other vehicle parameters throughout the flight. This provided information about the platform while airborne, alongside the performance analysis carried out after the system was recovered.
  • Surveillance payloads and platform control serve related but different purposes. A camera collects observations, while flight instrumentation helps describe vehicle behaviour; an operational system needs the observation mission and the flight system to work together.
  • The trial involved aviation and civil authorities, including the Indian Air Force and airspace agencies. Such coordination matters because experimental ascent, high-altitude flight and recovery take place within a wider managed aviation environment.

What the Trial Proves and What Remains Open

A successful experimental flight supports further development; its measured performance must remain distinct from the intended long-endurance surveillance mission.

  • The headline result combines a maximum altitude, time spent at a stated altitude and successful recovery. These are specific observations from the reported trial, rather than a declaration of unrestricted readiness for operational missions.
  • Maximum altitude and endurance answer different questions. Reaching a high point demonstrates ascent performance; remaining useful aloft for extended periods requires sustained support for flight, payload operation and communication under the relevant environmental conditions.
  • The long-endurance objective remains the development direction identified in the release. The reported time at altitude does not establish flights lasting weeks or months, continuous border surveillance or deployment of a service-ready platform.
  • Station-keeping means maintaining a useful position over an area. It is a separate performance question from altitude control; a platform staying at a given height does not, by itself, prove it stayed over one location.
  • Operational evaluation should examine repeatability, payload usefulness and recovery reliability. These are reasonable future assessment questions, not additional achievements claimed by the release; the announcement leaves the full operational performance envelope unspecified.

Way Forward

Evaluate the Full Mission

  • Report endurance and positional performance separately so altitude achievements are not mistaken for persistent coverage.
  • Test payload and communications reliability across representative conditions, documenting both successful performance and limitations.
  • Retain airspace coordination and recovery planning as the programme moves from experimental flights toward more demanding trials.

Conclusion

  • The trial is a meaningful development milestone for an indigenous lighter-than-air platform. Its value lies in demonstrated flight, telemetry and recovery, while long-endurance surveillance remains the intended application.
  • For an exam answer, connect buoyancy, payload and control, then distinguish atmospheric flight from orbit and experimental success from operational deployment. This preserves both the technological promise and the evidence limit.

UPSC Practice Questions

Prelims MCQ 1

With reference to the reported DRDO High-Altitude Platform trial, consider the following statements:

  1. The reported platform is a lighter-than-air system.
  2. The announcement establishes weeks of continuous operational surveillance.
  3. The system was recovered after a commanded descent.

How many of the above statements are correct?

(a) Only one (b) Only two (c) All three (d) None

Answer: (b) Only two

Explanation:

Statements 1 and 3 are supported by the Ministry of Defence release. It reports a limited experimental flight, not weeks of continuous operational surveillance.

Prelims MCQ 2

Which distinction between a lighter-than-air platform and an orbiting satellite is correct?

(a) Both remain aloft primarily through buoyancy. (b) Both must hover at a fixed location above Earth. (c) The platform relies on atmospheric lift, while satellite motion follows an orbit under gravity. (d) Reaching the stratosphere automatically establishes orbital flight.

Answer: (c) The platform relies on atmospheric lift, while satellite motion follows an orbit under gravity.

Explanation:

Buoyant lift requires surrounding air. Orbital motion depends on gravity and forward motion; reaching a stratospheric altitude does not mean a vehicle is in orbit.

UPSC Mains Questions

  1. Explain the significance of a lighter-than-air stratospheric platform for surveillance. What distinguishes an experimental flight milestone from demonstrated operational capability?
  2. Discuss how buoyancy, payload mass, flight control and ground communication shape high-altitude platform design. Why should altitude and endurance be assessed separately?

Sources: PIB, Ministry of Defence and NASA Scientific Balloon FAQs.

Frequently Asked Questions

What did DRDO report in this trial?

DRDO reported an experimental flight reaching 21 km above mean sea level, remaining at 20 km for more than 30 minutes, and ending with a commanded descent and successful recovery.

Is this a solar fixed-wing aircraft?

No. The release describes this specific platform as a lighter-than-air system being developed by ADRDE. It does not confirm a solar fixed-wing configuration or identify a particular lifting gas.

Does this trial prove long-endurance deployment?

No. Long-endurance stratospheric surveillance is the stated development objective. The reported altitude and time at altitude do not establish weeks of continuous flight or deployment of an operational surveillance service.

How is an airship different from a satellite?

An airship remains in the atmosphere and depends on lift. An orbiting satellite follows a path governed by gravity and forward motion; reaching a high atmospheric altitude does not establish an orbit.

IceCube: Detecting Cosmic Neutrinos Through Antarctic Ice

Open article →Download PDF

Why in News?

On 6 October 2026, the Physics Nobel was awarded to Francis Halzen for contributions to IceCube and the discovery of high-energy neutrinos of astrophysical origin.

  • The Nobel announcement recognises scientific leadership behind an international observatory and a new way of investigating energetic processes in the universe.
  • IceCube uses a cubic kilometre of Antarctic ice equipped with optical sensors, making rare particle interactions observable through the light they generate.
  • The crucial mechanism is indirect detection: a neutrino interaction produces charged secondary particles, whose light provides a measurable signal.
  • Neutrino astronomy adds particle evidence to observations made with light, helping investigate cosmic environments that accelerate particles to high energies.
  • A detected event and an identified source are different conclusions; reconstructing a signal does not automatically pinpoint the object that produced it.

UPSC Relevance

Prelims Relevance

  • Neutrinos have no electric charge and interact weakly with matter.
  • IceCube is a neutrino observatory in Antarctic ice near the South Pole.
  • Cherenkov light is emitted by charged particles moving faster than light travels in that medium.
  • Digital optical modules detect light rather than directly photographing neutrinos.
  • Atmospheric muons and neutrinos form backgrounds in cosmic-neutrino searches.

Mains Relevance

GS Paper 3

  • Indirect measurement and uncertainty in scientific discovery.
  • Neutrino astronomy as a complement to observations using electromagnetic radiation.

Essay

  • Scientific knowledge grows by turning invisible processes into testable evidence.

Background and Context

Why Antarctic Ice Can Act as a Detector

A neutrino usually passes through matter unnoticed; a large, transparent detector gives researchers more opportunities to record its rare interactions.

  • Neutrinos are electrically neutral particles with very small masses. Their lack of electric charge means magnetic fields do not deflect them as they deflect charged cosmic-ray particles travelling through space.
  • This makes neutrinos useful cosmic messengers: their arrival directions can carry information about where they originated. Identifying a particular source still depends on the quality and interpretation of the detected event.
  • Rare interactions explain the detector’s large size. Adding more instrumented material increases opportunities for an interaction; it does not mean the ice stops or captures every neutrino passing through it.
  • Deep Antarctic ice provides both interaction material and a medium through which secondary light can travel. Its transparency lets separated sensors record a common event rather than requiring a sensor at the interaction itself.
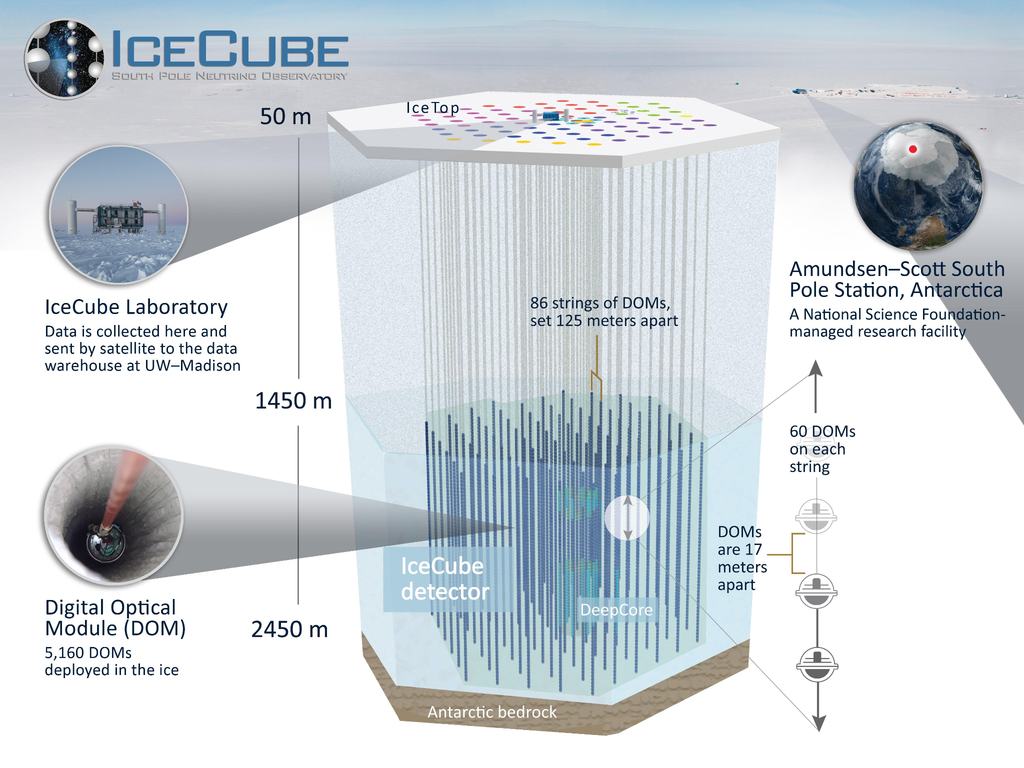
  • The IceCube Collaboration describes optical modules on vertical strings frozen into boreholes. This arrangement samples light across a large volume, while surface equipment collects the digitised information for analysis and reconstruction.

From a Neutrino Interaction to a Light Pattern

The instrument measures light from secondary charged particles, then uses its timing and distribution to reconstruct the event that produced it.

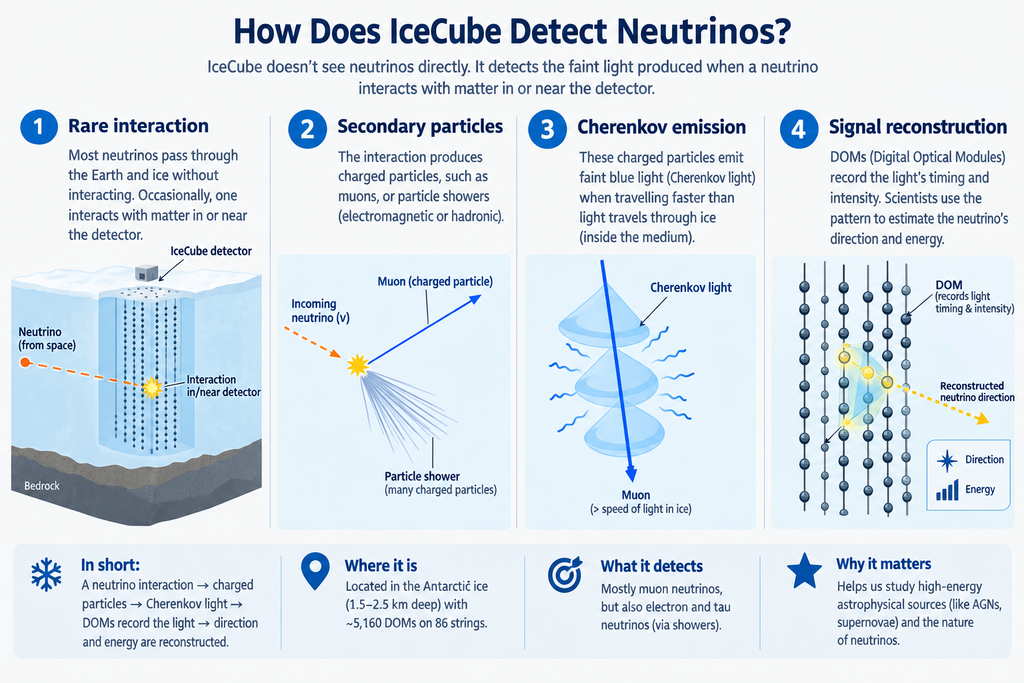
  • A neutrino interaction with matter can produce energetic charged particles. The neutrino itself is not photographed; the experiment infers its involvement from the observable particles and light generated in the interaction.
  • A sufficiently fast charged secondary produces Cherenkov radiation while moving through ice. The relevant threshold is the speed at which light travels in ice, not the greater speed of light in a vacuum.
  • No vacuum-speed limit is broken by this effect. Light travels more slowly through a material than in a vacuum, so a particle can outrun light in ice without exceeding the universal vacuum limit.
  • Optical modules record the arriving light and assign time stamps. Combining readings from many locations is more informative than one flash because it reveals how the detected pattern develops across the instrumented volume.
  • Event reconstruction uses that light pattern to estimate properties such as direction and energy. These are measurements with uncertainty, not an ordinary camera image showing a visible neutrino flying from a named star.
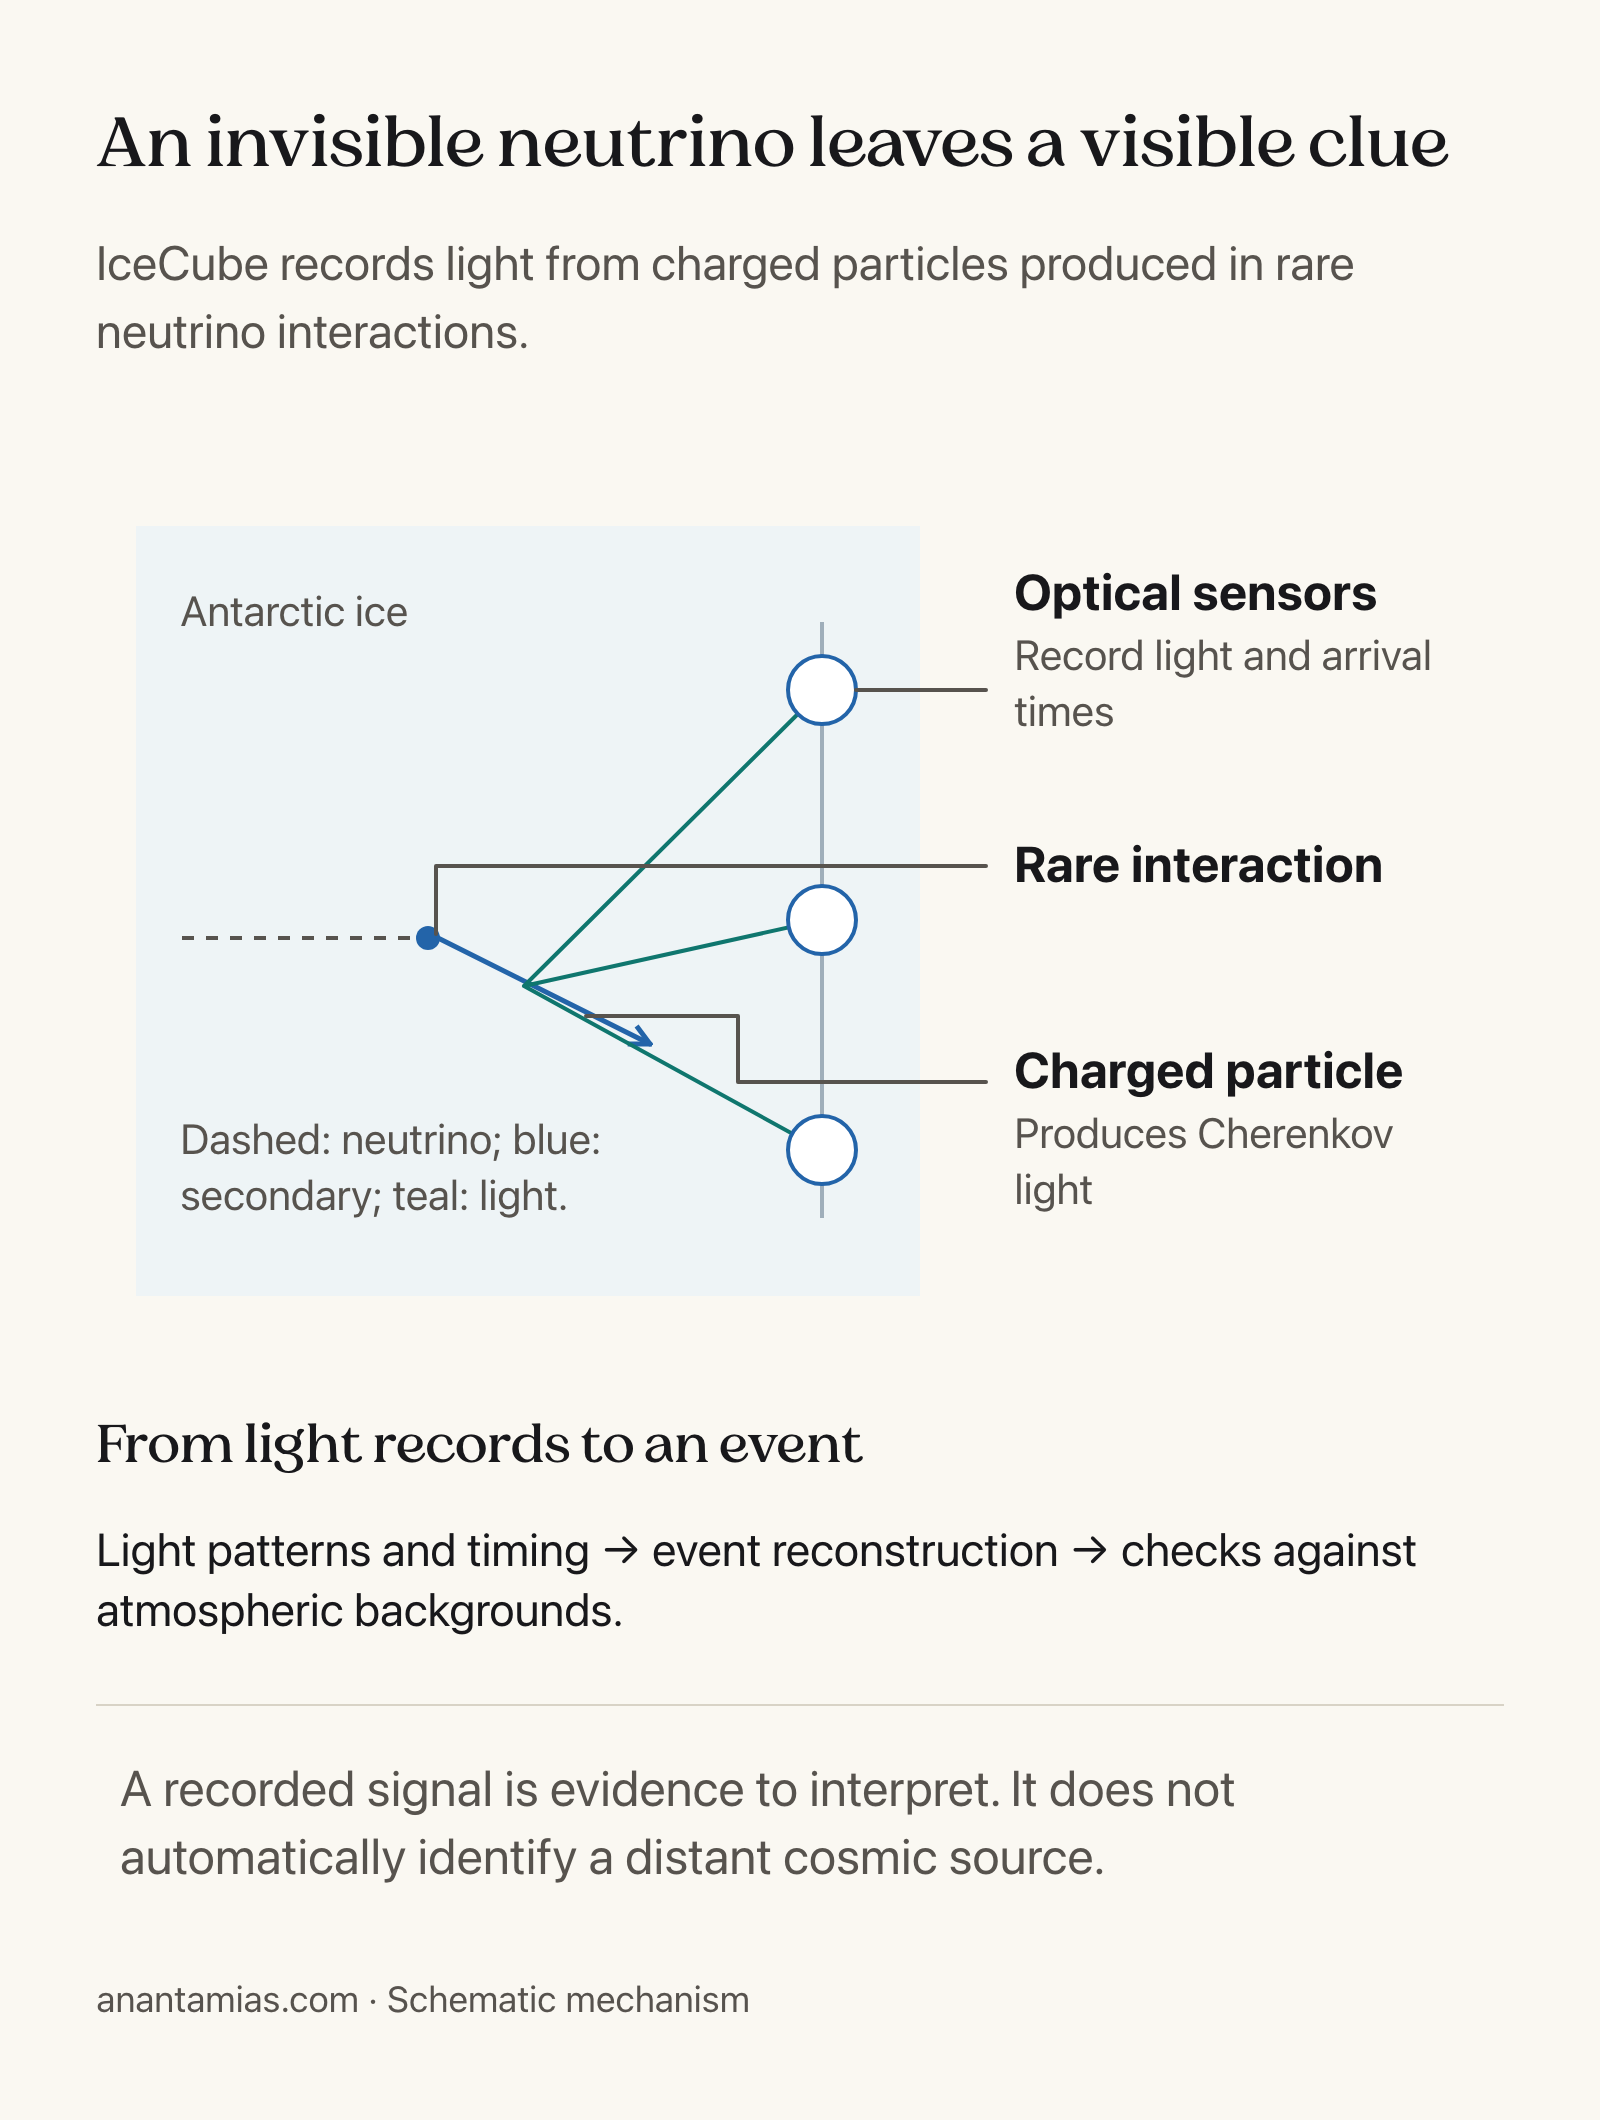
Schematic of a rare neutrino interaction, charged secondary particle and light reaching optical sensors in ice
IceCube records light and timing to reconstruct events. Light paths and instrument spacing are schematic, not measured emission angles or a particular detector event.

Why a Signal Still Needs Background Checks

Finding light in the detector starts the investigation; establishing an astrophysical neutrino signal requires separating it from other particles and nearby production processes.

  • Cosmic-ray interactions in Earth’s atmosphere produce muons and neutrinos. These can generate detector signals, so a neutrino detected at the South Pole need not have travelled from a distant cosmic accelerator.
  • Atmospheric backgrounds require careful event selection. IceCube research uses information such as direction, energy and where an event starts to distinguish likely cosmic-neutrino signals from competing explanations for the recorded light.
  • Earth can filter atmospheric muons in searches looking through the planet. Atmospheric neutrinos remain a background, so removing one interfering particle population does not eliminate every alternative origin for an event.
  • Directional reconstruction helps search the sky, but its precision depends on the event. A source claim needs evidence beyond naming whichever astronomical object happens to lie near an estimated arrival direction.
  • The durable distinction is detection versus interpretation: observed light supports an inferred particle interaction, while assigning a cosmic origin and associating a source require further analysis. Neither step constitutes a gravitational-wave detection.

Way Forward

Strengthen the Chain of Evidence

  • Improve detector calibration and reconstruction so uncertainties in light propagation and sensor response are reflected in reported event properties.
  • Report background rejection and source uncertainty alongside candidate events, keeping probable associations distinct from established conclusions.
  • Combine appropriate particle and electromagnetic observations when investigating a candidate source, without assuming that coincident detections automatically share an origin.

Conclusion

  • IceCube converts rare interactions into usable evidence through charged secondary particles, Cherenkov light and timed optical measurements; the ice is an active part of the measurement system.
  • For UPSC, remember the limits alongside the mechanism: faster than light in ice does not mean faster than light in vacuum, and reconstructing a neutrino event does not identify every cosmic source.

UPSC Practice Questions

Prelims MCQ 1

With reference to neutrino detection in IceCube, consider the following statements:

  1. A neutrino interaction can produce charged secondary particles.
  2. Cherenkov emission requires the charged particle to exceed the speed of light in a vacuum.
  3. Optical sensors record light that helps reconstruct the event.

How many of the above statements are correct?

(a) Only one (b) Only two (c) All three (d) None

Answer: (b) Only two

Explanation:

Statements 1 and 3 are correct. Cherenkov radiation requires a charged particle to move faster than light travels in the medium, not faster than light in a vacuum.

Prelims MCQ 2

Why must atmospheric backgrounds be considered when searching for cosmic neutrinos?

(a) Every atmospheric particle is electrically neutral (b) Antarctic ice prevents all neutrino interactions (c) Cosmic-ray interactions in the atmosphere produce particles that can contribute detector signals (d) Neutrinos are deflected towards the South Pole by Earth’s magnetic field

Answer: (c) Cosmic-ray interactions in the atmosphere produce particles that can contribute detector signals

Explanation:

Atmospheric muons and neutrinos can form backgrounds. A recorded event needs analysis before it is attributed to a distant astrophysical source.

UPSC Mains Questions

  1. Explain how IceCube uses Antarctic ice to detect neutrinos indirectly. Why is Cherenkov radiation consistent with the vacuum speed limit? (150 words)
  2. Discuss the contribution of neutrino astronomy to understanding energetic cosmic processes. Distinguish event detection, background rejection and source identification. (250 words)

Sources: Nobel Prize official press release and IceCube Collaboration detector overview.

Frequently Asked Questions

Does IceCube photograph neutrinos directly?

No. A rare neutrino interaction produces secondary particles, which can emit detectable light. IceCube records the light pattern and its timing, then reconstructs the event rather than photographing the neutrino itself.

Why is so much ice needed?

Neutrinos interact only rarely with matter. A large instrumented volume increases opportunities to observe an interaction, while transparent deep ice allows the resulting light to reach optical sensors at different locations.

Does Cherenkov radiation violate the speed of light?

No. A charged particle can travel faster than light moves through ice while remaining slower than light in a vacuum. Cherenkov emission concerns the medium’s light speed, not a violation of the vacuum limit.

Does each detected neutrino reveal a distant source?

No. Atmospheric processes also produce neutrinos, and reconstructed directions have uncertainties. Establishing an astrophysical origin and associating an individual source require additional analysis beyond detecting the event’s light in the instrument.

ITLA: Integrating Transport Planning and Technical Appraisal

Open article →Download PDF

Why in News?

On 6 October 2026, the Union Cabinet approved setting up the Integrated Transport and Logistics Authority (ITLA) as a special purpose vehicle for transport planning, appraisal and monitoring.

  • The proposed body will prepare a National Transport Master Plan covering multiple transport modes and align sectoral plans with it.
  • ITLA will undertake technical appraisal; existing mechanisms will continue financial appraisal.
  • A unified transport data repository is planned to support analysis, monitoring and impact assessment.
  • Transport efficiency depends on connections between modes, alongside the performance of individual roads, railways and ports.
  • The approval addresses fragmented planning; it does not establish that the new institution or its data systems are already operating.

UPSC Relevance

Prelims Relevance

  • ITLA is approved as a special purpose vehicle.
  • Its proposed mandate includes planning, technical appraisal, monitoring and impact assessment.
  • The National Transport Master Plan will cover multiple transport modes.
  • Technical appraisal and financial appraisal remain distinct functions.
  • Freight origin-destination analysis examines where freight movements begin and end.

Mains Relevance

GS Paper 3

  • Multimodal infrastructure planning and logistics efficiency.
  • Using transport data to assess network bottlenecks and project outcomes.

GS Paper 2

  • Coordination across ministries and accountability in institutional reform.

Essay

  • Public infrastructure works best when institutions connect investments to everyday outcomes.

Background and Context

Why Integrated Transport Planning Matters

A transport network delivers value through connected journeys; separate projects cannot be assessed only as isolated pieces of infrastructure.

  • Fragmentation is the problem identified in the Cabinet release: different ministries and agencies plan and implement transport investments. ITLA is intended to bring a shared planning perspective across those institutional boundaries.
  • Multimodal integration connects different transport modes within a journey. For example, a port expansion needs adequate onward connections; extra cargo-handling capacity alone cannot remove a bottleneck on the road or railway serving it.
  • The proposed National Transport Master Plan will cover roads, railways, shipping, aviation, waterways, urban mobility and logistics. Its planning horizon is ten years or more, providing a common long-term frame for investment choices.
  • ITLA will evaluate sectoral and annual plans for alignment with that master plan. The useful distinction is between ministries preparing their own programmes and an institution checking whether those programmes fit the wider network.
  • Network appraisal asks where an investment fits, rather than simply whether an asset can be built. For analysis, this means examining connections, alternative routes and bottlenecks that could limit the benefit of new capacity.

Technical Appraisal Is Different From Financial Appraisal

The approval separates the new technical role from existing financial scrutiny; combining planning does not mean concentrating every approval function in ITLA.

  • Technical appraisal is proposed for Government of India infrastructure projects costing ₹500 crore or more. The release explicitly retains existing financial appraisal mechanisms, so ITLA should not be described as replacing them.
  • The practical comparison is between project suitability and financial scrutiny. An investment can appear affordable yet connect poorly with other infrastructure; technical assessment helps examine whether the proposal serves its intended transport purpose.
  • Monitoring concerns implementation after a project proceeds. The announcement also proposes coordinated issue resolution, which matters when a delay or missing connection involves more than one agency rather than one implementing organisation.
  • Impact assessment asks what changed after implementation. It differs from checking construction progress: a completed asset and a better-performing transport system are related outcomes, but one does not automatically prove the other.
  • The release uses different threshold wording: appraisal covers the stated threshold and above, while monitoring covers projects above it. Avoid treating these formulations as identical when reading or answering a factual question.

What Transport Data Can and Cannot Establish

Shared data can inform decisions, but the announcement of a repository is not proof that integration or better outcomes have already occurred.

  • The proposed National Transport Data Repository will bring together relevant datasets from multiple systems. ITLA will use these for planning, monitoring and impact assessment rather than relying only on separate institutional information sources.
  • The announcement names freight origin-destination analysis as an application. This examines where freight starts and ends, helping planners understand movement patterns before deciding how different links or modes should connect along those journeys.
  • Data quality remains an implementation question: records collected for different purposes may need compatible definitions and careful interpretation. A larger combined dataset should not be assumed to represent every movement equally well.
  • Approval status is an exam-relevant limit. The Cabinet has approved setting up an SPV; the cited release does not establish an already functioning institution, a new statute or a transport operating authority.
  • Expected benefits include greater infrastructure efficiency and lower logistics costs. These are objectives stated in the release, rather than measured achievements; evaluating success requires evidence from implementation and subsequent outcomes.

Way Forward

Make Coordination Measurable

  • Specify responsibilities and decision timelines so technical scrutiny resolves coordination problems without adding an unexplained approval layer.
  • Define data-sharing and quality protocols, including access safeguards, before interpreting combined transport records.
  • Publish outcome evaluations that distinguish completed construction from improvements in connectivity, reliability and transport performance.

Conclusion

  • ITLA offers a proposed institutional response to fragmented transport planning. Its importance lies in connecting long-term plans, technical scrutiny and post-implementation evidence across a transport network.
  • In an answer, distinguish approval from operation, technical appraisal from financial appraisal, and projected benefits from demonstrated outcomes. These distinctions make the governance argument more precise.

UPSC Practice Questions

Prelims MCQ 1

With reference to the Cabinet approval for ITLA, consider the following statements:

  1. ITLA has been approved as a special purpose vehicle.
  2. Existing financial appraisal mechanisms will continue.
  3. The announcement proves that ITLA is already operating all national transport services.

How many of the above statements are correct?

(a) Only one (b) Only two (c) All three (d) None

Answer: (b) Only two

Explanation:

The first two statements match the Cabinet release. Approval to establish ITLA does not show that it is operational or that it operates transport services.

Prelims MCQ 2

Which question best illustrates post-implementation impact assessment of transport infrastructure?

(a) Has the construction contract been signed? (b) Has an initial design drawing been submitted? (c) Did the completed project improve transport performance? (d) Has the project been added to an annual proposal list?

Answer: (c) Did the completed project improve transport performance?

Explanation:

Impact assessment examines outcomes after implementation. Contracting, design submission and listing a proposal describe earlier steps, not resulting transport performance.

UPSC Mains Questions

  1. Explain how integrated transport planning can address weaknesses in project-by-project infrastructure development. Discuss with reference to the approved ITLA.
  2. Distinguish technical appraisal, implementation monitoring and post-implementation impact assessment. Why must their respective responsibilities remain clear in transport governance?

Source: PIB, Union Cabinet.

Frequently Asked Questions

What is ITLA?

The Integrated Transport and Logistics Authority is a special purpose vehicle approved by the Union Cabinet for integrated planning, technical appraisal, monitoring, research and related transport and logistics functions.

Will ITLA replace financial appraisal?

The Cabinet release assigns ITLA a technical appraisal role and explicitly states that financial appraisal will continue through existing mechanisms. These functions should not be treated as interchangeable.

Is ITLA already operational?

The cited announcement records Cabinet approval to set up ITLA. It does not establish that the institution or its proposed transport data repository is already functioning, and should not be read that way.

Why does multimodal planning matter?

A journey may use several transport modes. Planning their connections together helps identify bottlenecks that separate projects can overlook, such as a port expansion lacking adequate onward rail or road access.

OJ 287: Reading Black-Hole Activity Through Changing Light

Open article →Download PDF

Why in News?

On 6 October 2026, DST highlighted an ARIES-coordinated study of OJ 287 using optical observations from 2015–2025 to investigate its variable emission and binary black-hole interpretation.

  • The decade-long optical time series tracks changing brightness and colour over different timescales, with supporting observations elsewhere in the electromagnetic spectrum.
  • The study examines brightness, spectrum and polarization, using multiple properties of the received light to investigate the source.
  • The binary interpretation depends on observational evidence and modelling; the announcement does not report a directly resolved image of both black holes or detected gravitational waves from OJ 287.
  • A distant source can reveal its behaviour over time even when its central structures cannot be separately photographed.
  • The useful distinction is between measurements and interpretation: astronomers record light, then test physical models against those observations.

UPSC Relevance

Prelims Relevance

  • Blazar: an active galactic nucleus with a relativistic jet directed nearly along our line of sight.
  • Light curve: brightness measured against time.
  • Spectrum: the distribution of received light across wavelength or frequency.
  • Polarization: information about the orientation of light-wave oscillations.
  • ARIES: Aryabhatta Research Institute of Observational Sciences, an autonomous DST institution.

Mains Relevance

GS Paper 3

  • Long-term astronomical observation and the testing of physical models.
  • Indian research institutions and international collaboration in frontier science.

Essay

  • How indirect evidence can reveal things beyond direct observation.

Background and Context

Why OJ 287 Is a Useful Cosmic Laboratory

The central lesson is how a changing signal can reveal physical processes in a distant source without resolving every component in an image.

  • A blazar is an active galactic nucleus whose powerful jet points nearly toward the observer. This viewing geometry helps explain why such objects can appear exceptionally bright and vary strongly across the electromagnetic spectrum.
  • Accretion involves matter gathering around a black hole; the observable emission comes from surrounding material and associated jets. Light received from this environment should not be described as escaping from inside the event horizon.
  • OJ 287 has a history of paired brightness outbursts that motivates a binary supermassive black-hole interpretation. In this model, a smaller companion interacts with material around the larger black hole during its orbit.
  • The newly highlighted study assembled optical observations from 2015–2025. Sustained monitoring samples both long-term evolution and shorter fluctuations, supplying evidence that an isolated bright-state observation could miss.
  • ARIES coordinated the campaign with international collaborators and observations from several telescopes. Combining records extends temporal coverage, while the scientific task remains to interpret changes consistently across instruments and observing periods.

Three Different Questions Asked of the Light

Brightness, spectrum and polarization describe different properties of the received signal; their combined behaviour can test explanations more effectively than brightness alone.

  • A light curve records brightness over time. It shows when a source brightens, fades or repeats a pattern, allowing researchers to compare observed timing with the timing predicted by a physical model.
  • A spectrum separates light by wavelength or frequency. Changes in the relative strengths of different bands provide information beyond total brightness and can help distinguish contributions from different emitting components in the source.
  • Polarization describes preferred orientations in light-wave oscillations. As NASA explains, it provides clues to magnetic-field structure and particle behaviour in jets; it is a separate observable from how bright the source appears.
  • Comparing timescales asks whether slow trends and rapid fluctuations have the same explanation. A successful interpretation must account for the observed behaviour, rather than assuming that every flare has an identical physical cause.
  • Measurements across bands can test whether components brighten together or differently. Coordinated observations reduce ambiguity, but a correlation alone does not establish a unique causal mechanism or an exact spatial arrangement within the source.

What the Binary Interpretation Does Not Prove

The evidence is scientifically useful precisely when the distinction between a measured signal, a tested model and a future possibility remains explicit.

  • The binary model connects recurring outbursts with orbital behaviour. NASA’s earlier account describes flare-timing predictions tested against observations; this is model-based inference, not a photograph showing two individually resolved event horizons.
  • A new dataset is not an entirely new discovery: OJ 287 has been studied for decades. The present development adds a long observational record for examining variability and assessing interpretations of the system.
  • Multiwavelength astronomy combines radio, optical, X-ray or other electromagnetic observations. These remain observations of photons, despite their different energies; using several bands does not by itself establish a multimessenger detection.
  • Multimessenger astronomy combines distinct carriers of information, such as electromagnetic radiation with gravitational waves or neutrinos. The possibility of such connections should not be rewritten as an observed non-electromagnetic signal from this campaign.
  • Continued monitoring can test predictions against future observations and expose weaknesses in existing interpretations. Strong scientific reporting preserves uncertainty instead of converting a plausible physical explanation into evidence stronger than the measurements support.

Way Forward

Test Predictions With Coordinated Monitoring

  • Maintain long time-series observations to capture faint states, brief flares and long-term patterns with documented uncertainties.
  • Coordinate different electromagnetic bands so changes in brightness, colour and polarization can be compared over the same observing periods.
  • Report model assumptions and alternative explanations clearly; distinguish predicted signals from those actually detected.

Conclusion

  • OJ 287 illustrates the value of time-domain astronomy: repeated measurements reveal behaviour that a single image cannot. Brightness, spectrum and polarization offer complementary evidence about a distant active galactic nucleus.
  • The exam-ready distinction is observation versus inference. A model supported by changing light is not direct imaging, and multiple electromagnetic bands are not automatically multiple astronomical messengers.

UPSC Practice Questions

Prelims MCQ 1

With reference to blazars and astronomical observations, consider the following statements:

  1. A blazar has a relativistic jet directed nearly along the observer’s line of sight.
  2. A light curve represents brightness measured over time.
  3. Observing optical and radio photons necessarily constitutes a multimessenger detection.

How many of the above statements are correct?

(a) Only one (b) Only two (c) All three (d) None

Answer: (b) Only two

Explanation:

The first two statements are correct. Optical and radio observations are different electromagnetic wavelengths; both use photons and do not alone establish a multimessenger detection.

Prelims MCQ 2

What is the most accurate interpretation of a flare occurring when a binary black-hole model predicts it?

(a) It directly photographs both event horizons. (b) It establishes a gravitational-wave detection from the source. (c) It supplies observational support for the model’s timing prediction. (d) It proves that every flare has the same cause.

Answer: (c) It supplies observational support for the model's timing prediction.

Explanation:

Agreement between observation and prediction supports a model. It does not independently turn light measurements into direct imaging or a detection of gravitational waves.

UPSC Mains Questions

  1. Explain how long-term observations of brightness, spectrum and polarization can help investigate distant astronomical objects. (150 words)
  2. Distinguish multiwavelength from multimessenger astronomy. Discuss why scientific reporting must separate observations, model-based inferences and future possibilities. (250 words)

Sources: PIB, Department of Science and Technology and NASA: OJ 287 flare timing and binary model.

Frequently Asked Questions

What is special about OJ 287?

OJ 287 is a strongly variable blazar studied through recurring outbursts and other changes in its light. These observations have motivated and tested a binary supermassive black-hole interpretation of its central region.

What did the newly highlighted study observe?

The ARIES-coordinated campaign assembled optical observations spanning 2015–2025, supported by observations at other electromagnetic wavelengths. The record helps investigate changing brightness, colour and emission behaviour over different timescales in OJ 287.

Does the study directly image two black holes?

The announcement concerns light observations and their interpretation. It should not be presented as a directly resolved image of two event horizons, or as a reported gravitational-wave detection from OJ 287.

Are multiwavelength and multimessenger astronomy the same?

No. Multiwavelength astronomy combines electromagnetic bands, all carried by photons. Multimessenger astronomy adds distinct information carriers, such as gravitational waves or neutrinos, when those signals can be associated with the source or event.

Services Production Index: Measuring Non-Market Activities

Open article →Download PDF

Why in News?

On 6 October 2026, MoSPI released an approach paper proposing wider Index of Services Production coverage for education, health and residential care, and public administration and defence.

  • The expansion remains proposed; the release invites stakeholder feedback and does not announce implementation of the wider index.
  • The existing trial framework covers approximately 60% of services GVA; successful incorporation would raise coverage to approximately 78.4%, according to PIB.
  • The gaps concern core government activities, non-market services and GST-exempt services, which cannot all be captured through taxable outward supplies.
  • A coverage gap can hide changes in important public services even when the activities already contribute to the economy.
  • A wider monthly indicator needs defensible measurement of services delivered, alongside a clear account of the activities still excluded.

UPSC Relevance

Prelims Relevance

  • ISP: a short-term indicator of changes in real services output.
  • MoSPI: Ministry of Statistics and Programme Implementation.
  • Deflator: removes price changes from nominal values.
  • Non-market services: services supplied free or at prices that are not economically significant.
  • GVA weights: reflect the relative economic importance of services industries.

Mains Relevance

GS Paper 3

  • Measuring services growth using administrative data while addressing coverage and price-adjustment limitations.

GS Paper 2

  • Making public-service activity visible without equating expenditure with delivery or welfare.

Essay

  • What economic indicators reveal, and what their measurement boundaries leave unseen.

Background and Context

What the Proposed Expansion Changes

The issue is which services the monthly indicator can represent, rather than whether the omitted activities exist in the economy.

  • Trial compilation began in July 2026 with 2024–25 as the base year, according to PIB. The present framework uses high-frequency administrative records and GST outward-supply data to follow formal services activity.
  • Education, human health and residential care, and public administration and defence are the three proposed additions. Their inclusion would extend observation beyond the service activities represented in the initial framework.
  • Non-market production includes services supplied free or at prices that are not economically significant. A public classroom can provide education without generating a market sale comparable to a commercial transaction.
  • GST exemption and non-market production are different concepts: exemption concerns tax treatment, while non-market status concerns how output is supplied. Neither should be treated as another name for informal employment.
  • The MoSPI announcement is an approach-paper consultation, not a completed expansion. Treat its prospective coverage as conditional; do not present the proposed sectors as already incorporated into an operational revised monthly series.

How Production Differs From Money Spent

An output index seeks changes in service volume; rupee values can change because prices change even when the service quantity does not.

  • Value-based indicators use sales, revenue or outward supplies. Higher receipts can reflect increased charges rather than additional services, so nominal growth alone cannot establish an equivalent increase in real production.
  • A price deflator removes price movements from nominal values to estimate volume changes. The choice must fit the activity: an unsuitable price measure can distort the apparent pace of services growth.
  • Quantity indicators directly observe an activity, such as passenger-kilometres in air transport. The official ISP FAQs distinguish these from value-based indicators that need price adjustment to track real output over time.
  • Spending is an input-side measure: a larger public wage bill or costlier supplies need not mean more lessons or care delivered. These examples explain measurement limits, not the paper’s final chosen methodology.
  • Different services need different indicators because their outputs are heterogeneous. A classroom, a hospital and public administration cannot be reduced to one universal physical unit without explicit aggregation choices and clearly stated limitations.

What a Wider Index Can and Cannot Show

Broader coverage improves representation, but it does not automatically settle quality, informality or the interpretation of public-service performance.

  • Administrative data can improve timeliness, but records collected for taxation or programme management need statistical scrutiny. Changes in reporting or coverage must be separated from changes in the underlying activity being measured.
  • GST outward supplies help observe taxable transactions; they do not by themselves fill non-market service gaps. Wider coverage requires appropriate additional evidence rather than assuming every service produces a usable tax return.
  • GVA-based weights represent industries’ relative economic importance in aggregation, as explained in the FAQs. Do not infer final weights for the proposed additions from headline coverage percentages in the announcement alone.
  • Output, quality and outcomes answer different questions. More recorded services do not independently establish better learning or health; an activity index should be interpreted alongside evidence on access, quality and results.
  • Informal-sector coverage remains a separate issue. Adding major omitted service areas does not establish universal observation of all providers; readers must check the final framework before treating a broader ISP as the whole services economy.

Way Forward

Make the Measurement Choices Auditable

  • Publish sector-specific methods, coverage boundaries and revision rules so users can distinguish measured activity from estimates and assumptions.
  • Explain how prices, inputs and output are separated, especially where services lack observable market sales.
  • Test comparability over time before combining added sectors with the existing series; disclose breaks caused by revised coverage or reporting.

Conclusion

  • The proposed ISP expansion addresses a representation gap, but an approach paper is not an implemented statistical series. Coverage claims must retain that distinction until the revised framework is adopted.
  • For analytical answers, separate money spent, services produced and outcomes achieved. A useful high-frequency index measures a defined aspect of activity; it cannot substitute for every assessment of public-service performance.

UPSC Practice Questions

Prelims MCQ 1

With reference to the Index of Services Production, consider the following statements:

  1. A price deflator helps separate price movements from nominal service values.
  2. GST outward-supply records alone capture all non-market services.
  3. The October approach paper itself establishes that expanded coverage is already implemented.

How many of the above statements are correct?

(a) Only one (b) Only two (c) All three (d) None

Answer: (a) Only one

Explanation:

Only the first statement is correct. GST records cannot alone capture the omitted non-market activities; the October expansion is a proposal under consultation.

Prelims MCQ 2

Which observation most directly illustrates why spending cannot automatically be treated as service output?

(a) A ministry records its expenditure electronically. (b) Higher input prices raise expenditure without increasing services delivered. (c) A statistical agency publishes monthly data. (d) A sector contributes to national GVA.

Answer: (b) Higher input prices raise expenditure without increasing services delivered.

Explanation:

Expenditure can rise because inputs become costlier. Measuring real output requires distinguishing this from an increase in the volume of services.

UPSC Mains Questions

  1. Explain the difficulties in measuring non-market services through a high-frequency production index. How can wider coverage improve economic analysis? (150 words)
  2. Distinguish public expenditure, service output and social outcomes. Discuss the safeguards needed when using administrative data to assess services activity. (250 words)

Sources: PIB, Ministry of Statistics and Programme Implementation and MoSPI: FAQs on Index of Services Production.

Frequently Asked Questions

What is the Index of Services Production?

The ISP is a short-term indicator of changes in the volume of services output relative to a base period. Its purpose is to track real activity rather than merely changes in nominal receipts.

Has MoSPI already implemented the expanded coverage?

The 6 October release describes an approach paper and invites stakeholder comments. Education, health and residential care, and public administration and defence are proposed additions, not confirmed incorporated components of an implemented revised series.

Why can GST data not capture all services?

GST outward-supply records observe relevant taxable transactions. Core government activities, non-market services and exempt services may not generate suitable records, so the proposed expansion needs evidence beyond those returns alone.

Does higher public spending mean higher service production?

Not necessarily. Spending can increase because wages or other inputs become more expensive. Real service output requires a suitable activity measure, while quality and social outcomes require further evidence.

SME Growth Fund: Patient Equity for Expanding Enterprises

Open article →Download PDF

Why in News?

On 6 October 2026, the Union Cabinet approved a government commitment towards establishing the SME Growth Fund for direct equity investments in small and medium enterprises.

  • The PIB announcement describes growth equity for enterprises with demonstrated business viability and scalability, addressing a financing gap beyond access to ordinary credit.
  • The commitment will go to an Alternative Investment Fund under the framework; most allocation is intended for small and medium manufacturing enterprises.
  • The fund will also consider enterprises in industrial clusters in Tier II and Tier III cities, connecting growth finance with regional production networks.
  • Approval establishes a policy commitment; the release does not establish completed investments, operating results or realised employment gains.
  • Growth finance matters when a viable enterprise needs capital for machinery, technology or market expansion before those investments begin generating sufficient cash.
  • Public risk capital raises a governance question: how can professional selection support expansion without insulating weak investments from scrutiny?

UPSC Relevance

Prelims Relevance

  • Equity as an ownership claim; debt as a repayment obligation.
  • Alternative Investment Funds and defined investment policies.
  • Patient capital and the timing of enterprise returns.
  • Cabinet commitment versus fund investment and realised outcomes.

Mains Relevance

GS Paper 3

  • Access to growth capital, manufacturing productivity and SME competitiveness.
  • Equity financing, investment risk and the limits of credit-led enterprise support.

GS Paper 2

  • Transparent selection and accountability in publicly supported investment funds.

Essay

  • Enterprise growth requires institutions that can share uncertainty responsibly.

Background and Context

What Gap Does Patient Equity Address?

A business can have a credible expansion opportunity while lacking the capital structure needed to pursue it.

  • Growth capital supports an enterprise moving beyond its existing capacity. The release identifies technology adoption, manufacturing expansion, international markets and strategic investments as intended uses, rather than treating every financing need alike.
  • Patient capital allows time for business expansion to produce returns. Buying equipment or developing a market creates costs before reliable additional sales emerge, so the timing of finance matters alongside its availability.
  • Business viability concerns whether the enterprise can sustain its activity; scalability concerns whether it can expand successfully. The announcement names both, but does not publish detailed selection tests or application conditions.
  • Manufacturing emphasis links the fund to productive capacity, technology and supply chains. However, an intended sectoral focus is not evidence that a particular factory, cluster or company has already received investment.
  • Capital constraints are only one barrier to growth. An investment cannot by itself ensure demand, reliable inputs, managerial capability or competitive products; these conditions affect whether additional capacity becomes commercially useful.

How Does Equity Differ From Credit?

The central comparison is ownership risk versus a contractual repayment obligation; the two forms of finance serve different needs.

  • Equity represents ownership in a company. As SEBI explains, shareholder returns depend on business performance, with potential appreciation accompanied by risk; an equity investment is not a guaranteed return.
  • Debt creates an obligation to repay according to agreed terms. Ordinary borrowing can fund expansion, but interest and repayment commitments may put pressure on cash flows while the new capacity is still developing.
  • Risk sharing means an equity investor participates in uncertain business outcomes. Avoiding a conventional loan repayment schedule does not make capital free: existing owners share future gains and may dilute their ownership.
  • Patient equity is not a grant or loan waiver. Its policy purpose here is to support viable expansion through investment; the release does not specify ownership percentages, return guarantees or exit deadlines.
  • Financing fit depends on the project and firm. A business with predictable cash flows may use debt effectively, while uncertain expansion can need risk capital; neither instrument is automatically superior in every case.

Why Do Fund Governance and Selection Matter?

Pooling capital can support specialist investment decisions, but the quality of those decisions determines whether public commitments produce useful results.

  • An AIF is a privately pooled investment vehicle with a defined investment policy for its investors, under SEBI regulations. It is an investment structure, not a synonym for bank credit.
  • Professional appraisal should examine business prospects, accounts, management and proposed use of capital. These are analytical safeguards for selecting investments, not a claim that the announcement has already prescribed these exact operational rules.
  • Selection risk arises when public support favours well-connected applicants or projects that would obtain equivalent finance anyway. Clear investment reasoning helps distinguish an additional growth opportunity from a transfer without meaningful additional benefit.
  • Investment monitoring should follow how firms use capital and whether expansion improves productive capability. Disbursing money is an intermediate step; it cannot substitute for evidence of sustained competitiveness or successful commercial outcomes.
  • Accountability must recognise genuine investment uncertainty while examining avoidable failures. Losses alone do not prove misconduct, but poor appraisal, conflicts of interest and concealed deterioration should never be dismissed as unavoidable market risk.

Way Forward

Make Investment Decisions Reviewable

  • Publish selection principles, conflict-of-interest safeguards and reporting requirements when operational arrangements are finalised, allowing enterprises and citizens to understand the basis for support.
  • Assess additionality: identify how proposed investment enables viable expansion beyond what the enterprise could finance on comparable terms without public support.
  • Track business outcomes over a suitable period, separating committed capital, completed investments and realised improvements in productive capability.

Conclusion

  • The SME Growth Fund addresses the structure and patience of enterprise finance, not simply its volume: ownership capital shares business risk while conventional credit retains repayment obligations.
  • For a Mains answer, connect growth finance with selection quality and accountable management. Treat productivity, export competitiveness and employment as intended outcomes requiring evidence after investment, rather than achievements established by Cabinet approval.

UPSC Practice Questions

Prelims MCQ 1

With reference to the SME Growth Fund announcement, consider the following statements:

  1. It envisages direct equity investment in small and medium enterprises.
  2. Cabinet approval proves that the supported enterprises have already generated additional employment.
  3. The government commitment is intended for an Alternative Investment Fund under the framework.

How many of the above statements are correct?

(a) Only one (b) Only two (c) All three (d) None

Answer: (b) Only two

Explanation:

Statements 1 and 3 reflect the announcement. Employment is an expected outcome, not a verified result of completed investments.

Prelims MCQ 2

Which statement best distinguishes equity finance from conventional borrowing?

(a) Equity guarantees a fixed return to the investor. (b) Equity always preserves the existing owners’ ownership share. (c) Equity gives an ownership claim with returns exposed to business performance. (d) Equity removes all risks associated with business expansion.

Answer: (c) Equity gives an ownership claim with returns exposed to business performance.

Explanation:

Equity involves ownership and uncertain business returns. Conventional borrowing creates contractual interest and repayment obligations; equity does not remove commercial risk.

UPSC Mains Questions

  1. How can patient equity address financing constraints faced by growth-stage small and medium enterprises? Examine its benefits and limits compared with conventional credit.
  2. Publicly supported growth funds require both commercial judgement and public accountability. Discuss appropriate selection and monitoring safeguards.

Sources: PIB, Cabinet and SEBI, Alternative Investment Funds Regulations.

Frequently Asked Questions

What is the SME Growth Fund intended to do?

The announced fund aims to supply patient growth equity to viable, scalable small and medium enterprises. Manufacturing is the main intended allocation focus, with industrial clusters also under consideration.

Is the SME Growth Fund a loan-waiver scheme?

No. The announcement concerns direct equity investment through an Alternative Investment Fund framework. Equity involves ownership and business risk; a loan waiver instead cancels an existing repayment obligation.

Does patient capital guarantee successful expansion?

No. More time for returns can help an enterprise invest, but demand, management, technology and execution still determine performance. Patient capital remains exposed to the possibility of business losses.

Has Cabinet approval established job creation?

No. Approval records the government’s commitment towards establishing the fund. Employment and competitiveness are expected benefits; they require evidence from subsequent investment and enterprise performance before being reported as achieved.

Kasturi Cotton gains as traceability in textiles turns crucial

Open article →Download PDF

Why in news?

About 2.1 lakh bales were certified as Kasturi Cotton Bharat in 2025-26, up from 47,100 in 2023-24, as global buyers demand traceability.

UPSC Relevance – 

Prelims: Kasturi Cotton Bharat, CCI

What is Kasturi Cotton Bharat?

  • Brand: India’s first national brand for its cotton, launched by the Ministry of Textiles on World Cotton Day (7 October) 2020.
  • Who runs it: A joint effort of the government, the Cotton Corporation of India (CCI), trade bodies and industry. CCI and the Cotton Textiles Export Promotion Council (TEXPROCIL) handle implementation, so the industry largely regulates itself.
  • How it works: Cotton from registered ginning units must meet set quality norms (fibre length, strength, low trash and contamination). Samples are tested, and certified bales get a QR code.
  • Traceability: Each certified lot is recorded on a blockchain, so a buyer can trace yarn, fabric or garment back to the ginning unit and the source.
  • Model: Similar to premium cotton brands abroad, like Egypt’s Giza or the U.S. Supima, which fetch higher prices because of an assured identity.
  • Significance of Kasturi Cotton Bharat
    • Better prices: A trusted brand can earn a premium for ginners and, if passed on, for farmers.
    • Export competitiveness: Helps meet EU and U.S. due diligence rules and supports gains from trade deals like the India-UK CETA and the India-EU FTA.
    • Farm to Foreign: Fits the government’s ‘5F’ vision: Farm to Fibre to Factory to Fashion to Foreign.
    • Digital India in agriculture: Shows how technology can add value to farm produce, as tea, coffee and spices boards are also trying.
    • Resilience: Helps diversify markets at a time when U.S. tariffs have hurt Indian textile exports.

Cotton Corporation of India

  • The Cotton Corporation of India (CCI) is a public sector undertaking set up on 31 July 1970 under the Companies Act, 1956.
  • It is wholly owned by the Government of India, works under the Ministry of Textiles, and is headquartered at Navi Mumbai.
  • CCI is the Centre’s nodal agency for Minimum Support Price operations in cotton. When market prices of kapas (raw seed cotton) fall below MSP, it buys from farmers. The MSP itself is fixed by the government on the recommendation of the CACP. 
  • Beyond price support, CCI also buys and sells cotton commercially. It supplies the textile industry and helps stabilise prices.
  • Cott-Ally app. CCI launched the Cott-Ally mobile app for farmers. It provides information on MSP rates, nearby procurement centres, payment tracking and good farming practices.

Practice MCQ

Q1. With reference to Kasturi Cotton Bharat, consider the following statements:

  1. It was launched by the Ministry of Textiles.
  2. It uses blockchain technology to trace cotton through the textile value chain.
  3. It is a Geographical Indication (GI) tag given to cotton grown in Gujarat.

How many of the above statements are correct?

(a) Only one

(b) Only two

(c) All three

(d) None

Answer: (b). Statement 3 is incorrect. Kasturi Cotton Bharat is a national brand and certification for Indian cotton, not a GI tag linked to one region.

Nobel Prize in Physics 2026

Open article →Download PDF

Why in News?

Francis Halzen, a Belgian-born physicist at the University of Wisconsin-Madison, has been awarded the 2026 Nobel Prize in Physics for his decisive contributions to the IceCube Neutrino Observatory and the discovery of high-energy neutrinos of astrophysical origin. His work helped establish neutrinos as messengers for studying some of the universe’s most energetic phenomena. 

UPSC Relevance: GS-3 Science and Technology: Nobel Prize in Physics 

Prelims: Nobel Prize in Physics, Neutrino, IceCube Neutrino Observatory

What are Neutrinos?

  • Neutrinos are fundamental subatomic particles belonging to the Lepton family (fermions).
  • Charge: Neutral (no electric charge); hence, they are not deflected by magnetic or electric fields.
  • Mass: Extremely small, but non-zero (proven by neutrino oscillation). They are much lighter than electrons.
  • They are called Ghost Particles, as:
    • They interact extremely weakly with matter. Billions of neutrinos pass through every square centimetre of the Earth (and our bodies) every second without colliding with a single atom.
    • Detection requires massive underground detectors (e.g., IceCube in Antarctica, or India’s upcoming INO – India-based Neutrino Observatory).
  • Major Sources of Neutrinos:
    • Natural Sources:
      • Nuclear fusion reactions inside the Sun and stars.
      • Core-collapse Supernovae 
      • Cosmic rays interacting with Earth’s atmosphere (atmospheric neutrinos).
      • Big Bang relics (Cosmic Neutrino Background).
    • Artificial Sources:
      • Nuclear fission power reactors.
      • Particle accelerators.
image 7

IceCube Neutrino Observatory:

  • Location: Deployed at the Amundsen-Scott South Pole Station in Antarctica.
  • Scale: It is the world’s premier cubic-kilometre-scale neutrino telescope.
  • Architecture: Consists of 5,160 Digital Optical Modules (DOMs) suspended along 86 vertical strings dropped into deep boreholes.
  • Depth: Positioned between 1.45 km and 2.45 km beneath the surface. At this depth, the extreme pressure makes the ice exceptionally clear and free of air bubbles.
  • Timeline: Construction was completed in 2010. 

How does IceCube detect Neutrinos?

  1. Rare interaction: Most neutrinos pass through the ice unnoticed. Occasionally, one high-energy neutrino collides with an atom in the ice. 
  2. Secondary particles: This interaction (collision) produces secondary charged particles (like muons).
  3. Cherenkov emission: As these charged particles (muons) travel faster than the speed of light in the ice, they emit a faint light (Cherenkov radiation).
  4. Signal reconstruction: The DOMs record the light’s timing and intensity. Scientists use the pattern to estimate the neutrino’s direction and energy. 

Note: The charged particle exceeds light’s speed in the medium, not light’s speed in a vacuum. Thus, Cherenkov radiation does not violate relativity. The light is emitted by the secondary charged particles, not directly by the neutrino. 

Why Antarctica? The deep Antarctic ice sheets provide an abundant, ultra-pure, and optically transparent medium that acts both as the target material and the shield against surface background radiation.

image 6

Objective of IceCube Neutrino Observatory & Discoveries:

  • High-Energy Cosmic Messengers: Detects high-energy astrophysical neutrinos originating from violent cosmic events (e.g., blazars, active galactic nuclei, and gamma-ray bursts).
  • Locating cosmic accelerators: Charged cosmic rays are deflected by magnetic fields. Electrically neutral neutrinos can preserve information about their source direction. Thus, unlike photons (light), high-energy neutrinos can travel from the edge of the observable universe unhindered by dust, gas, or magnetic fields, and give a clear picture of cosmic accelerators like black holes and active galactic nuclei.
  • Dark Matter Search: Looks for indirect signatures of dark matter, such as neutrinos produced by dark matter annihilation in the Sun or the galactic centre.
  • Exploring physics beyond the Standard Model: Neutrino masses, their ordering, and differences between neutrino and antineutrino behaviour remain major research questions. Their study may help explain how neutrinos acquire mass. 

Key Milestone: In 2018, IceCube traced a high-energy neutrino back to a blazar (TXS 0506+056), a giant elliptical galaxy with a spinning black hole at its core, marking a breakthrough in multi-messenger physics. 

Thus, IceCube demonstrates how fundamental research can create new ways of observing the universe. 

Prelims Practice MCQ:

Q. With reference to neutrino detection, consider the following statements:

  1. IceCube detects light emitted by secondary charged particles produced in neutrino interactions.
  2. Cherenkov radiation requires particles to travel faster than light in a vacuum.
  3. Neutrino oscillations provide evidence that neutrinos have mass.

Which of the statements given above are correct?

(a) 1 and 2 only
(b) 1 and 3 only
(c) 2 and 3 only
(d) 1, 2 and 3

Answer: (b) 

Why does NASA want to build a Nuclear Reactor on the Moon?

Open article →Download PDF

Why in News?

NASA and the U.S. Department of Energy are advancing Nuclear Fission power for sustained lunar exploration. A 2026 U.S. directive calls for a lunar surface reactor ready for launch by 2030, with mid-power designs providing at least 20 kilowatts of electricity (kWe) for at least five years on the Moon. 

UPSC Relevance: GS-3 Science and Technology: Space Technology 

Prelims & Mains: Lunar South Pole, Lunar Nuclear Reactor, Outer Space Treaty, and Artemis Accords.

Why does the Moon need Nuclear Power?

  • Electricity through the lunar night: The Moon has an approximately 14-Earth-day-long day and night cycle. Solar power is therefore difficult to rely upon continuously, particularly during the prolonged lunar night. Nuclear fission can provide continuous electricity independent of sunlight, making it particularly valuable for long-duration human and robotic missions.
  • Sustaining habitats and equipment: Long-duration missions need uninterrupted electricity for life-support, heating, communications, scientific instruments, and rover charging. 
  • Enabling In-Situ Resource Utilisation (ISRU): ISRU involves using locally available materials to support exploration. E.g., (i) Lunar water ice could be extracted for consumption. (ii) Electrolysis can produce oxygen and hydrogen for life support and propellant.
    • However, extraction, processing, and storage consume substantial power.  A 2020 NASA study estimated 68 kW is needed for a system producing 10 tonnes of oxygen over 225 days. 
    • Thus, initial mid-power reactors (20kW) serve as a foundational capability rather than full infrastructure for a large industrial base.

Why the Lunar South Pole?

  • The south pole has emerged as the principal focus of competing lunar exploration programmes because it combines several advantages.
    • Some elevated locations receive relatively long periods of sunlight, making them favourable for solar power.
    • Permanently shadowed craters can preserve water ice.
  • The region therefore offers the possibility of combining solar energy, nuclear power and local resources. At the same time, the terrain is extremely challenging, with steep slopes, craters and large areas of permanent darkness.

What kind of Nuclear Power is proposed?

  • A fission reactor is proposed that uses a controlled chain reaction to generate heat. A fission reactor offers scope for much higher electrical output.
  • It differs fundamentally from a Radioisotope Thermoelectric Generator (RTG), which generates low-level power (under 1 kW) from the natural radioactive decay of elements like Plutonium-238.

Strategic Competition and Space Law:

The U.S. is pursuing the Artemis programme, while China and Russia are developing the International Lunar Research Station (ILRS). This creates a potential strategic competition over lunar infrastructure, where power generation could become as important as landing astronauts.

(i) The Outer Space Treaty, 1967:

  • Article I: Establishes freedom of exploration and use, including free access to celestial bodies.
  • Article II: Prohibits national appropriation through sovereignty claims, occupation or other means.
  • Article IV: Restricts nuclear weapons and other weapons of mass destruction on celestial bodies. It does not prohibit peaceful nuclear power systems.
  • Article IX: Requires due regard for other states’ interests, avoidance of harmful contamination and consultation over potentially harmful interference.

(ii) Artemis Accords and Safety zones: 

  • The Artemis Accords provide a framework for implementing principles of the Outer Space Treaty during lunar exploration.
  • They envisage temporary safety zones around activities where harmful interference could occur. Such zones are supposed to be based on the nature of the activity, be temporary and respect the principle of free access.

The critics argue that expansive, overlapping safety zones could be used to practically restrict access to valuable resource sites, creating de facto exclusion zones without violating Article II explicitly. 

India’s Position: As an Artemis Accords signatory (since 2023), India is uniquely positioned to act as a bridge between competing space blocs. India must advocate for non-exclusive access to lunar resources while accelerating its domestic technical capabilities in space robotics, vacuum-rated thermal control, and high-voltage space power management.

Breaking Leprosy Transmission: India’s Challenge beyond Elimination

Open article →Download PDF

Why in News?

The National Leprosy Eradication Programme (NLEP) Annual Report 2025-26 highlights that despite India achieving national-level elimination as a public health problem in 2005, localised transmission remains rampant. 

Severe gaps against programme projections underscore the urgent need to overhaul the National Strategic Plan (NSP) and Roadmap for Leprosy 2023-27 to move from statistical elimination to interrupting transmission. 

UPSC Relevance: GS-2 Social Justice: Health; GS-3 Science and Technology: Diseases   

Prelims: Leprosy, Govt initiatives to eliminate Leprosy 

Key Data (NLEP 2025-26 & WHO Metrics):

  • Case Load: 91,783 new cases were detected nationwide, including 3832 children. Indian children accounted for nearly 46% of all global cases reported among children in 2025.
  • National Prevalence Rate: Stood at 0.56 per 10,000 population (well below the elimination threshold of 1 per 10,000).
  • District Performance: Only 148 districts were provisionally identified as having interrupted transmission (pending rigorous field verification), falling short of the projected 300 districts.
  • The Projection Gap: Actual findings overshot the programme’s 2025-26 projections across key indicators:
    • Overall New Cases: Overshot by 41%
    • Childhood Incidence: Overshot by 91.6%
    • Grade-2 Disability (G2D) Rate: Overshot by 34%

What is Leprosy?

  • Also known as Hansen’s disease, it is a chronic infectious disease caused primarily by the rod-shaped bacterium Mycobacterium leprae. It is classified by the WHO as a Neglected Tropical Disease (NTD).
  • Transmission: Spreads via respiratory droplets from the nose and mouth during prolonged, close contact with an untreated individual. It is not transmitted via casual contact (e.g., shaking hands, hugging, or sharing food).
  • Incubation Period: Highly variable, averaging 5 years, though symptoms can take up to 20 years or longer to manifest due to the slow replication of the pathogen.
  • Pathology: It primarily targets the skin, peripheral nerves, mucosa of the upper respiratory tract, and the eyes. Classic clinical signs include pale or reddish skin patches with a distinct loss of sensation, muscle weakness, and tingling. Left untreated, it causes progressive, permanent nerve damage and physical deformities.
  • Standard Treatment (MDT): Leprosy is entirely curable using Multidrug Therapy (MDT). It uses a combination of Rifampicin, Dapsone, and Clofazimine.
    • Paucibacillary (PB) cases: Treated for 6 months.
    • Multibacillary (MB) cases: Treated for 12 months.

Why does Transmission Continue?

  • Elimination vs. Interruption of Transmission: India’s 2005 milestone defined elimination purely as a registered prevalence under 1 per 10,000 people. It did not mean zero transmission. Active childhood cases in India are a stark warning that community transmission is prevalent.
  • Statistical Illusion of Shorter Regimens: Advanced MDT regimens successfully reduced the duration for which a patient remains on formal treatment registers. While this legally and statistically lowered the “prevalence rate” on paper, it did not stop the underlying pathogen transmission in unscreened populations.
  • National Averages mask Regional Hotspots: The low national average (0.56/10,000) conceals severe hyper-endemic pockets. States like Chhattisgarh, Jharkhand, Odisha, and Maharashtra, alongside the UT of Chandigarh, remain above the elimination threshold. 
  • Stigma-Diagnostic Delay Trap: Deep-rooted social stigma forces patients to hide symptoms. Concurrently, many clinical practitioners frequently misdiagnose early nerve involvement as a generic, benign skin condition. 

Current Institutional Interventions:

  • National Leprosy Eradication Programme (NLEP): Launched in 1983 as a Centrally Sponsored Scheme under the National Health Mission (NHM). It institutionalises free diagnosis, MDT, disability prevention, and medical rehabilitation services across the public healthcare layer.
  • National Strategic Plan (NSP) and Roadmap (2023-2027): A targeted strategy designed to fast-track the absolute interruption of leprosy transmission at the district level by 2027.
  • Revised Three-Drug Regimen (Implemented April 1, 2025): To prevent drug resistance and strengthen clearance, India updated its clinical guidelines to administer the three-drug MDT combination (Rifampicin + Dapsone + Clofazimine) to both PB and MB cases. This added Clofazimine to the erstwhile two-drug PB regimen.
  • Contact-Based Post-Exposure Prophylaxis (PEP): Active tracing is paired with the administration of Single-Dose Rifampicin (SDR-PEP) to eligible close contacts. In 2025-26, this prophylactic coverage reached an impressive 91.1% of the 16.9 lakh identified close contacts.

Technological and Grassroots Surveillance:

  • Nikusth 2.0: A centralised digital platform utilised for the real-time recording, geolocated reporting, and long-term treatment follow-up of leprosy cases.
  • Mass Field Mobilisation: In 2025-26, healthcare workers executed massive case-detection campaigns, screening over 70 crore people in high-endemic areas. Frontline ASHA workers flagged nearly 40 lakh suspected cases, of which 48,027 cases were clinically confirmed.
  • Sparsh Leprosy Awareness Campaign: Nationwide community-level behavioural change communication drive aimed at dismantling misconceptions, reducing social exclusion, and promoting voluntary reporting.
  • Antimicrobial Resistance (AMR) Surveillance: Targeted network to monitor and isolate M. leprae strains showing resistance to first-line MDT drugs.

The MIP Vaccine:

To accelerate elimination, the government is actively deliberating the strategic rollout of the Mycobacterium indicus pranii (MIP) Vaccine.

  • An indigenous, killed-bacterial vaccine developed in India. It is derived from a non-pathogenic, soil-borne mycobacterium that shares safe structural antigens with M. leprae.
  • Mechanism of Action: It boosts host cell-mediated immunity (CMI). When deployed as an adjunct immunotherapy alongside standard MDT, it significantly accelerates bacterial clearance in highly infectious Multibacillary (MB) patients. It has also shown efficacy in providing long-term preventive protection to close contacts.
  • The vaccine is currently under deliberation for targeted use in highly infectious cohorts to clear persistent reservoirs. It is not yet a nationwide open rollout.

Way Forward:

  • Shift Performance Metrics: Move focus from deceptive “prevalence rates” to direct transmission indicators like childhood incidence trends, detection timelines, and diagnostic delays.
  • Incentivise High Detection: Resist relaxing screenings to meet artificial deadlines; treat initial spikes in case counts as a surveillance success rather than a policy failure.
  • Hyper-Local Resource Mapping: Transition from broad state-level funding to block-level operational plans that concentrate intensive contact tracing and SDR-PEP in known endemic pockets.
  • Synergise Pediatric Care: Break NLEP silos by integrating leprosy screening directly with school health checkups and pediatric networks like the Rashtriya Bal Swasthya Karyakram (RBSK) to tackle high child case rates.
  • Provide Holistic Post-Cure Care: Extend interventions beyond bacterial clearance to include long-term nerve monitoring, reconstructive surgeries, and psychosocial rehabilitation.

India’s next milestone requires sustained interruption of transmission, supported by early diagnosis, contact-based prevention and dignified care. 

Practice MCQ: 

Q. With reference to Leprosy (Hansen’s disease) and India’s public health policies, consider the following statements:

1. Leprosy is a bacterial disease that primarily affects the skin and peripheral nerves.

2. Under the updated National Leprosy Eradication Programme (NLEP) guidelines, a uniform three-drug multidrug therapy (MDT) regimen is now administered to both Paucibacillary (PB) and Multibacillary (MB) cases.

Which of the statements given above are correct?

(a) 1 only

(b) 2 only

(c) Both 1 and 2

(d) Neither 1 nor 2 

Answer: (c)