
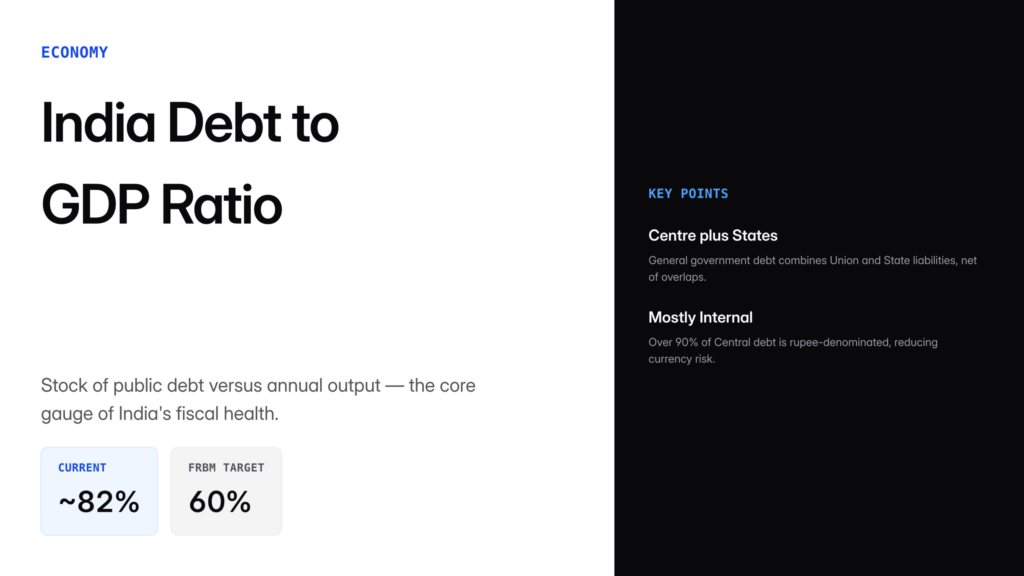
The India debt to GDP ratio is one of the most closely watched indicators of the country's fiscal health, capturing the size of total government liabilities relative to the annual output of the economy. A high ratio signals that a government owes a large stock of debt compared with what its economy produces in a year, which can raise borrowing costs, crowd out private investment, and constrain social spending. For UPSC aspirants, this ratio ties together the FRBM Act, the Union Budget, the N. K. Singh Committee recommendations, and recurring debates on fiscal consolidation. This guide explains how the ratio is calculated, how India compares with peers, and why it matters for macroeconomic stability.
What is the Debt to GDP Ratio?
The debt to GDP ratio expresses a government's total outstanding liabilities as a percentage of its Gross Domestic Product. It is a stock-to-flow measure: the numerator is a stock of accumulated debt, while the denominator is the annual flow of national income.
- A ratio of 80% means debt equals 80% of one year's GDP.
- It is used by the IMF, World Bank, rating agencies, and the RBI to assess solvency.
- It differs from the fiscal deficit, which measures annual borrowing, not the stock of debt.
In India, the relevant aggregate is General Government Debt (GGD), which combines the liabilities of the Union and State governments after netting out inter-governmental holdings.
Components of India's Public Debt
India's public debt is reported at two levels.
| Level | Key Instruments | Approximate Share |
|---|---|---|
| Central Government | Dated G-secs, Treasury Bills, Small Savings, External Debt | ~57% of GDP |
| State Governments | State Development Loans (SDLs), NSSF loans | ~28% of GDP |
| Combined General Government | Consolidated, net of overlaps | ~80-83% of GDP |
Key features:
- Internal debt dominates – over 90% of Central debt is rupee-denominated, limiting currency risk.
- External debt of the Centre is mostly from multilateral agencies (World Bank, ADB) on concessional terms.
- Dated securities (long-maturity G-secs) are the single largest instrument, held by banks, insurers, EPFO, and the RBI.
- State debt is rising because of the Finance Commission's devolution framework and market borrowing caps under Article 293(3).
Evolution of the Ratio: A Timeline
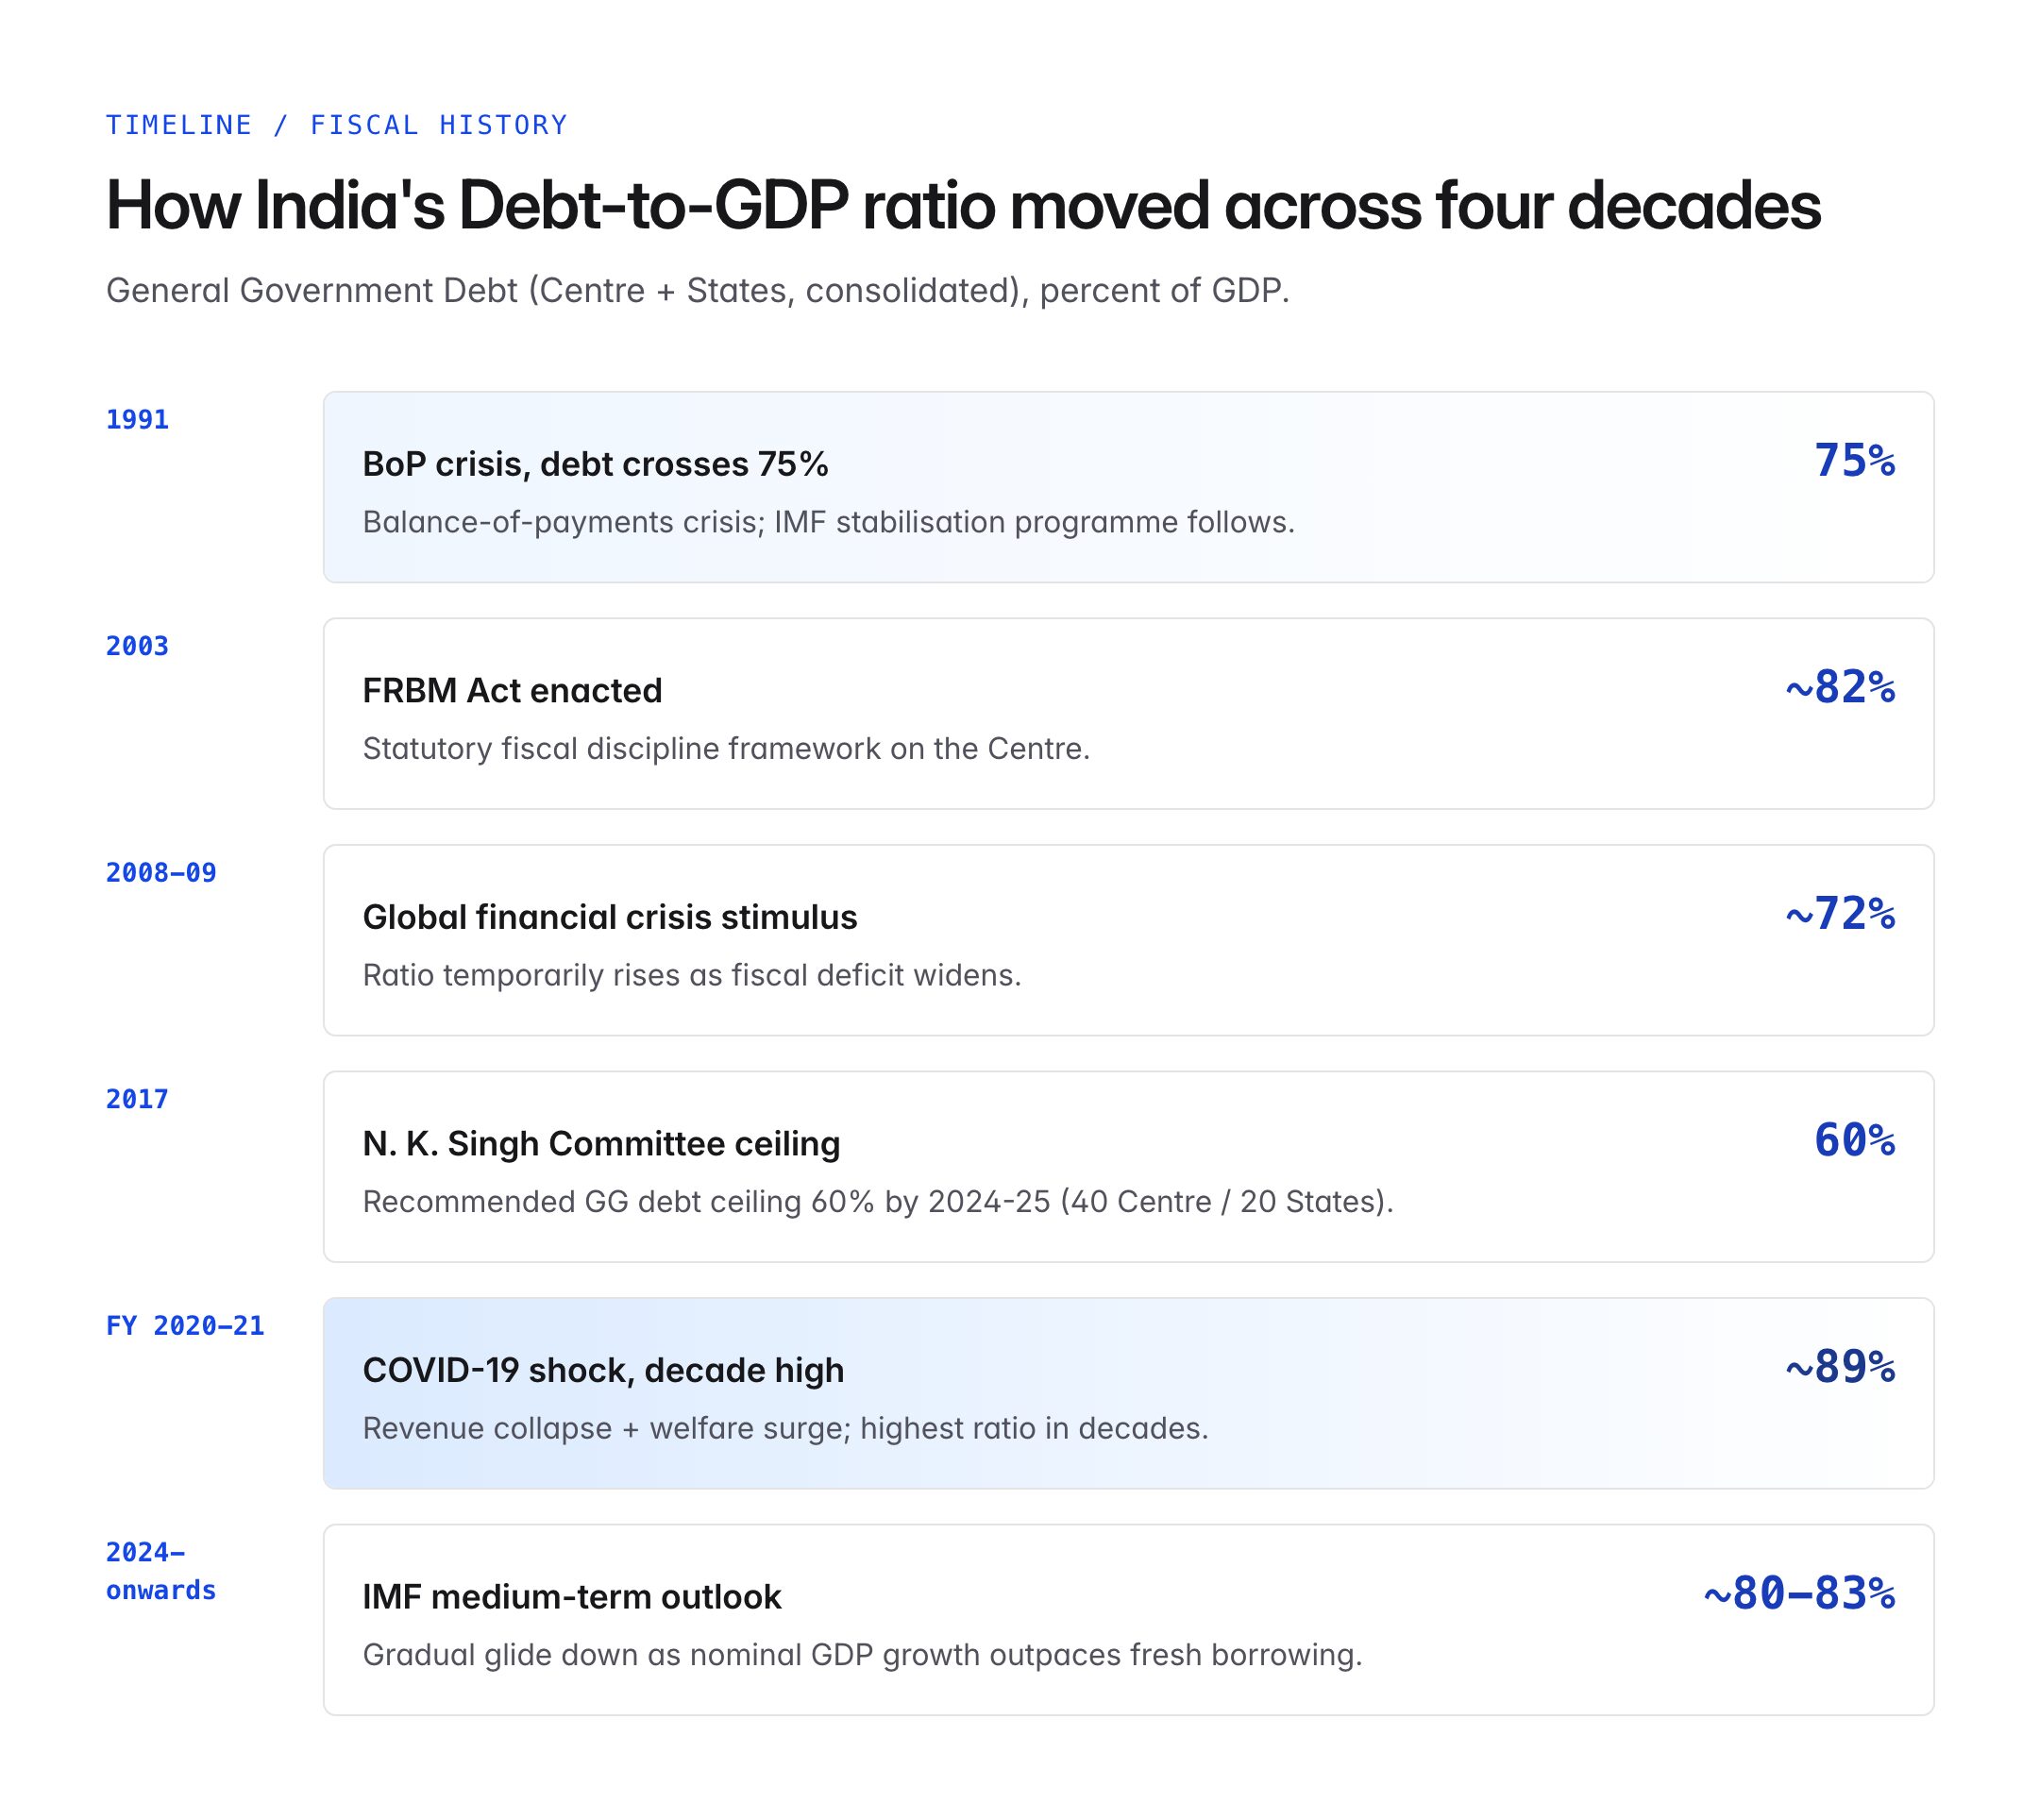
- 1991 crisis: General government debt crossed 75% of GDP, contributing to the balance-of-payments crisis.
- FRBM Act, 2003: Enacted to impose statutory fiscal discipline on the Centre.
- 2008-09 global crisis: Fiscal stimulus pushed the ratio up temporarily.
- N. K. Singh Committee, 2017: Recommended a general government debt ceiling of 60% of GDP by 2024-25 (40% Centre, 20% States) and a glide path for fiscal deficit.
- COVID-19 shock (FY 2020-21): The combined debt ratio spiked to around 89% of GDP, the highest in decades, as revenues collapsed and health and welfare spending surged.
- Post-pandemic consolidation: The ratio has been gradually declining as nominal GDP growth outpaces fresh borrowing. The IMF projects it to remain around the low-80s percent of GDP over the medium term, with the government aiming for a downward glide path.
Why the Ratio Matters
A sustainable India debt to GDP ratio is central to macroeconomic stability.
- Interest burden: Interest payments are the single largest item in the Union Budget's revenue expenditure, absorbing roughly a quarter of receipts. A higher ratio entrenches this burden.
- Crowding out: Large government borrowing can push up yields on G-secs, raising the cost of capital for private firms.
- Sovereign rating: Agencies such as S&P, Moody's, and Fitch weigh debt dynamics heavily in rating decisions, which in turn influence external borrowing costs.
- Intergenerational equity: Debt taken today must be serviced by future taxpayers; excessive accumulation transfers the burden forward.
- Policy space: A lower ratio gives governments room to respond to shocks – pandemics, wars, climate disasters – without destabilising markets.
However, debt is not inherently bad. If borrowed funds are channelled into capital expenditure – highways, railways, power, irrigation – they can raise future GDP and effectively lower the ratio through the denominator.
How India Compares Globally
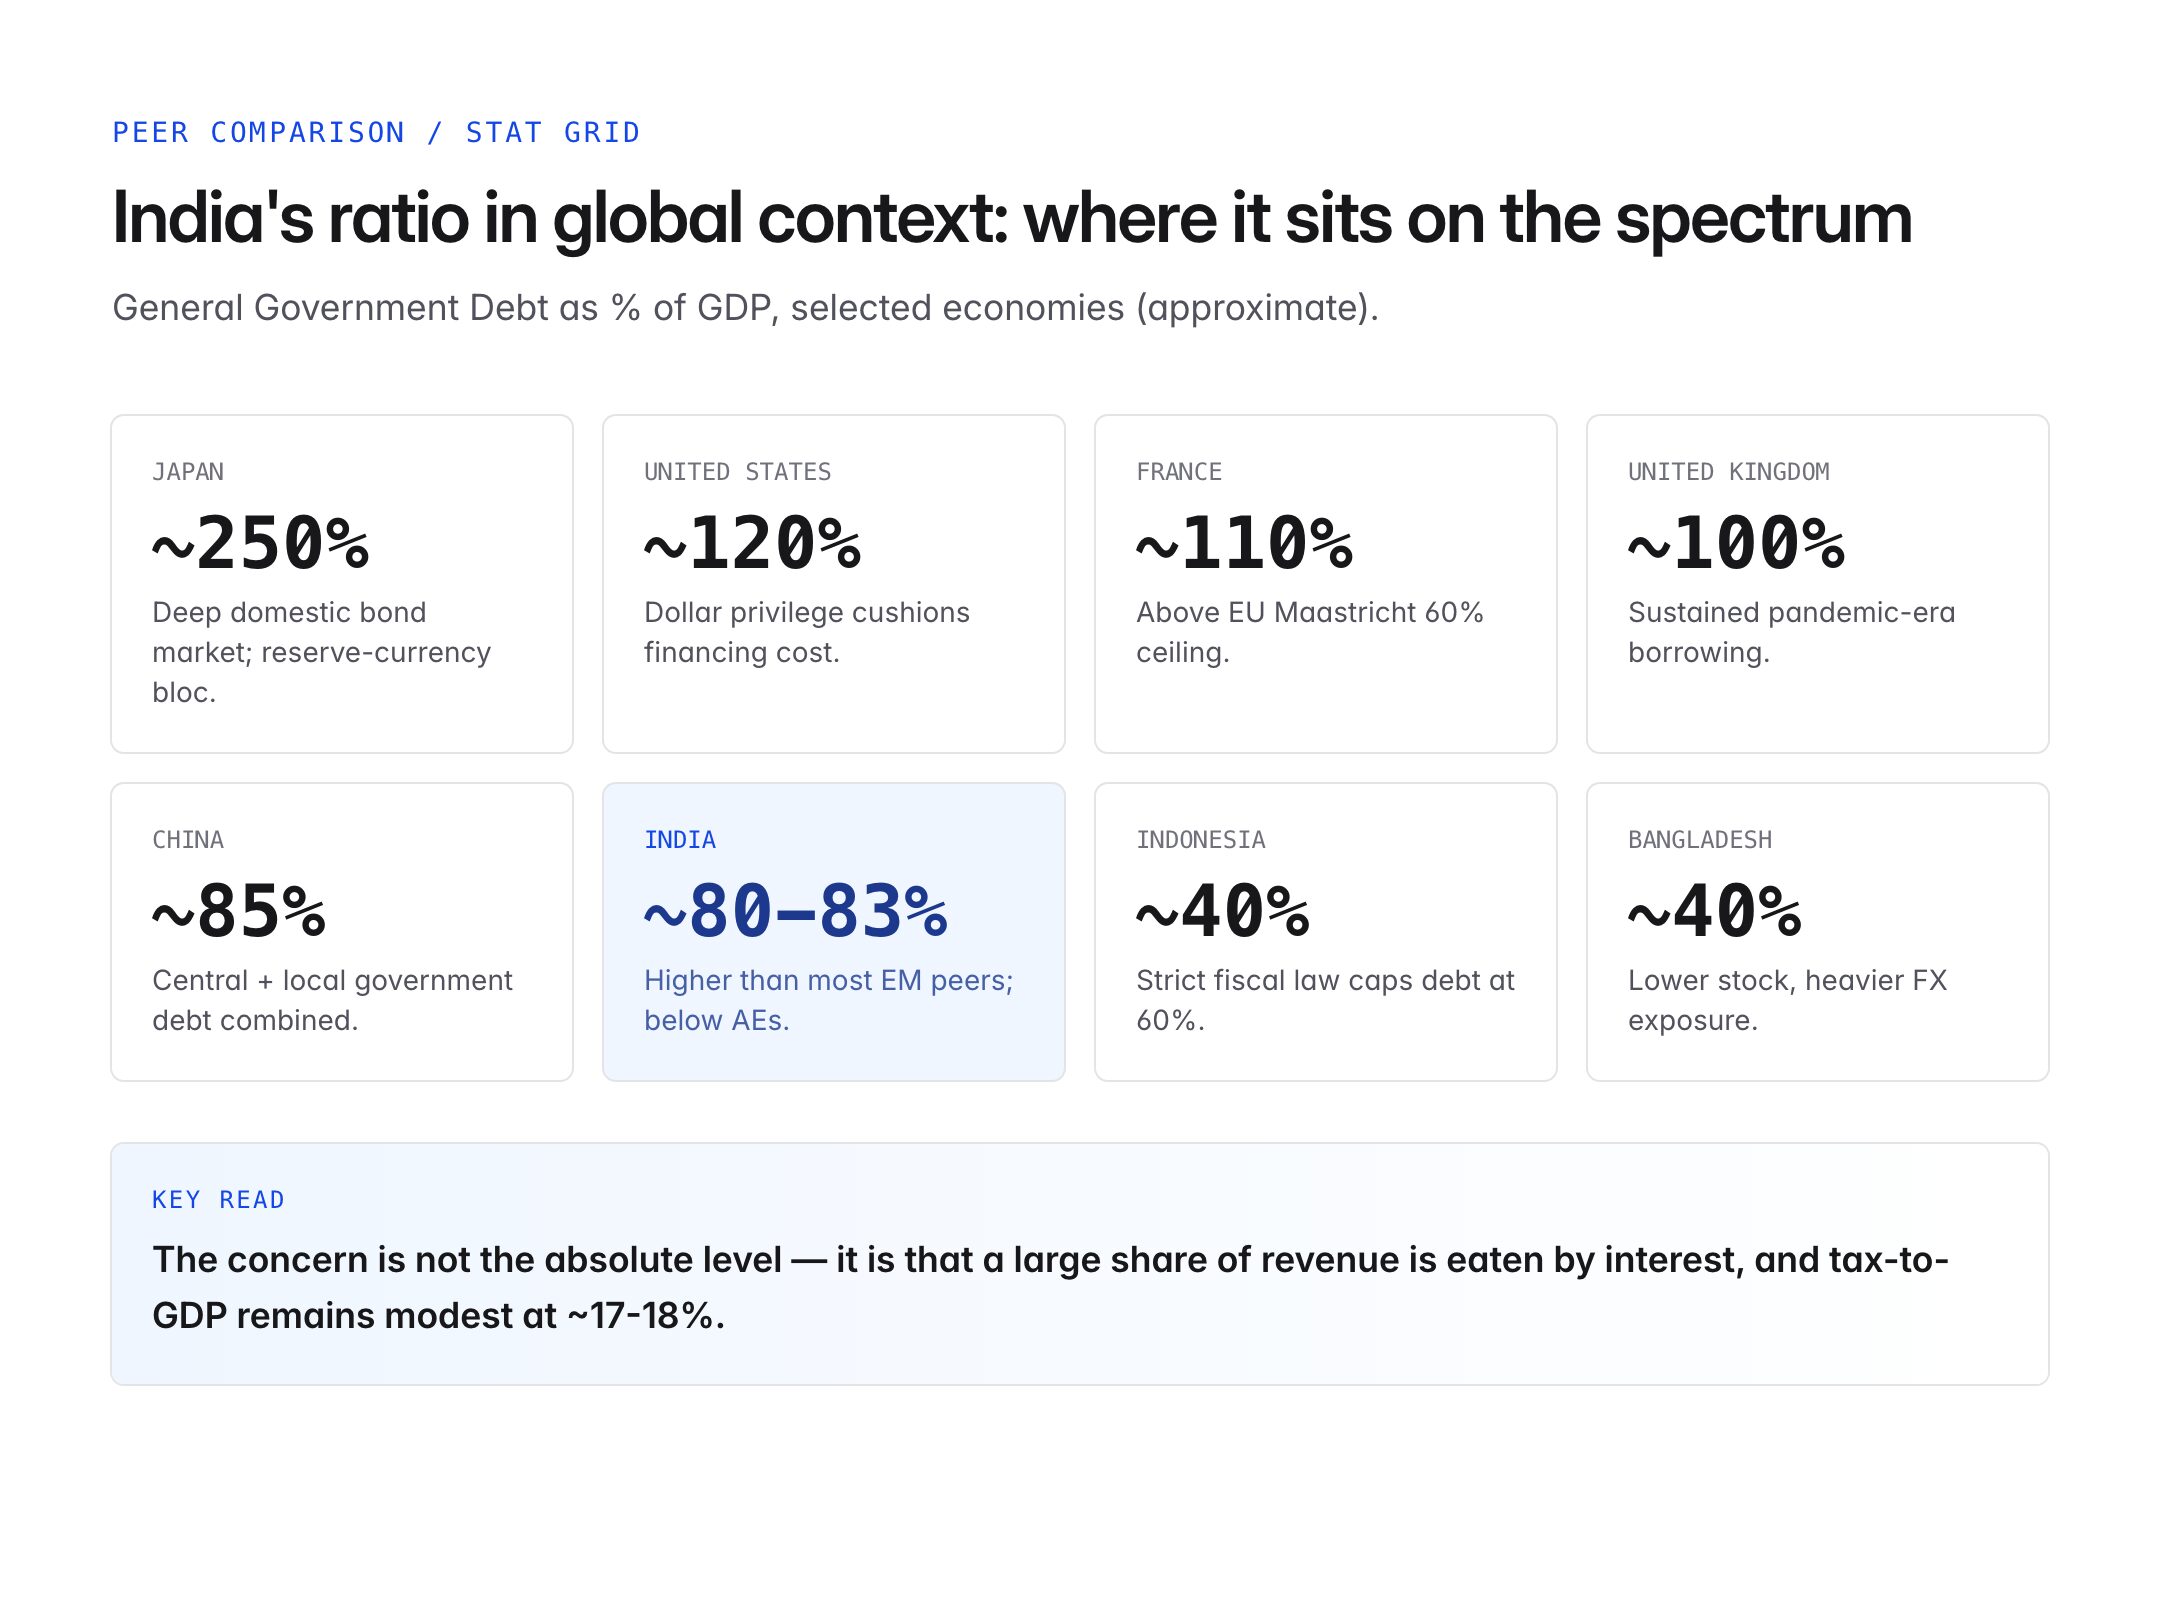
Debt ratios must be read in context. Advanced economies often run much higher ratios because of deep capital markets and reserve-currency status.
| Country | General Govt Debt/GDP (approx.) |
|---|---|
| Japan | ~250% |
| United States | ~120% |
| France | ~110% |
| United Kingdom | ~100% |
| India | ~80-83% |
| China | ~85% (central + local) |
| Indonesia | ~40% |
| Bangladesh | ~40% |
India's ratio is higher than most emerging-market peers but lower than advanced economies. The concern is less the absolute level and more that a large share of revenue is consumed by interest, and that tax-to-GDP remains modest at around 17-18%.
Fiscal Framework and the Road Ahead
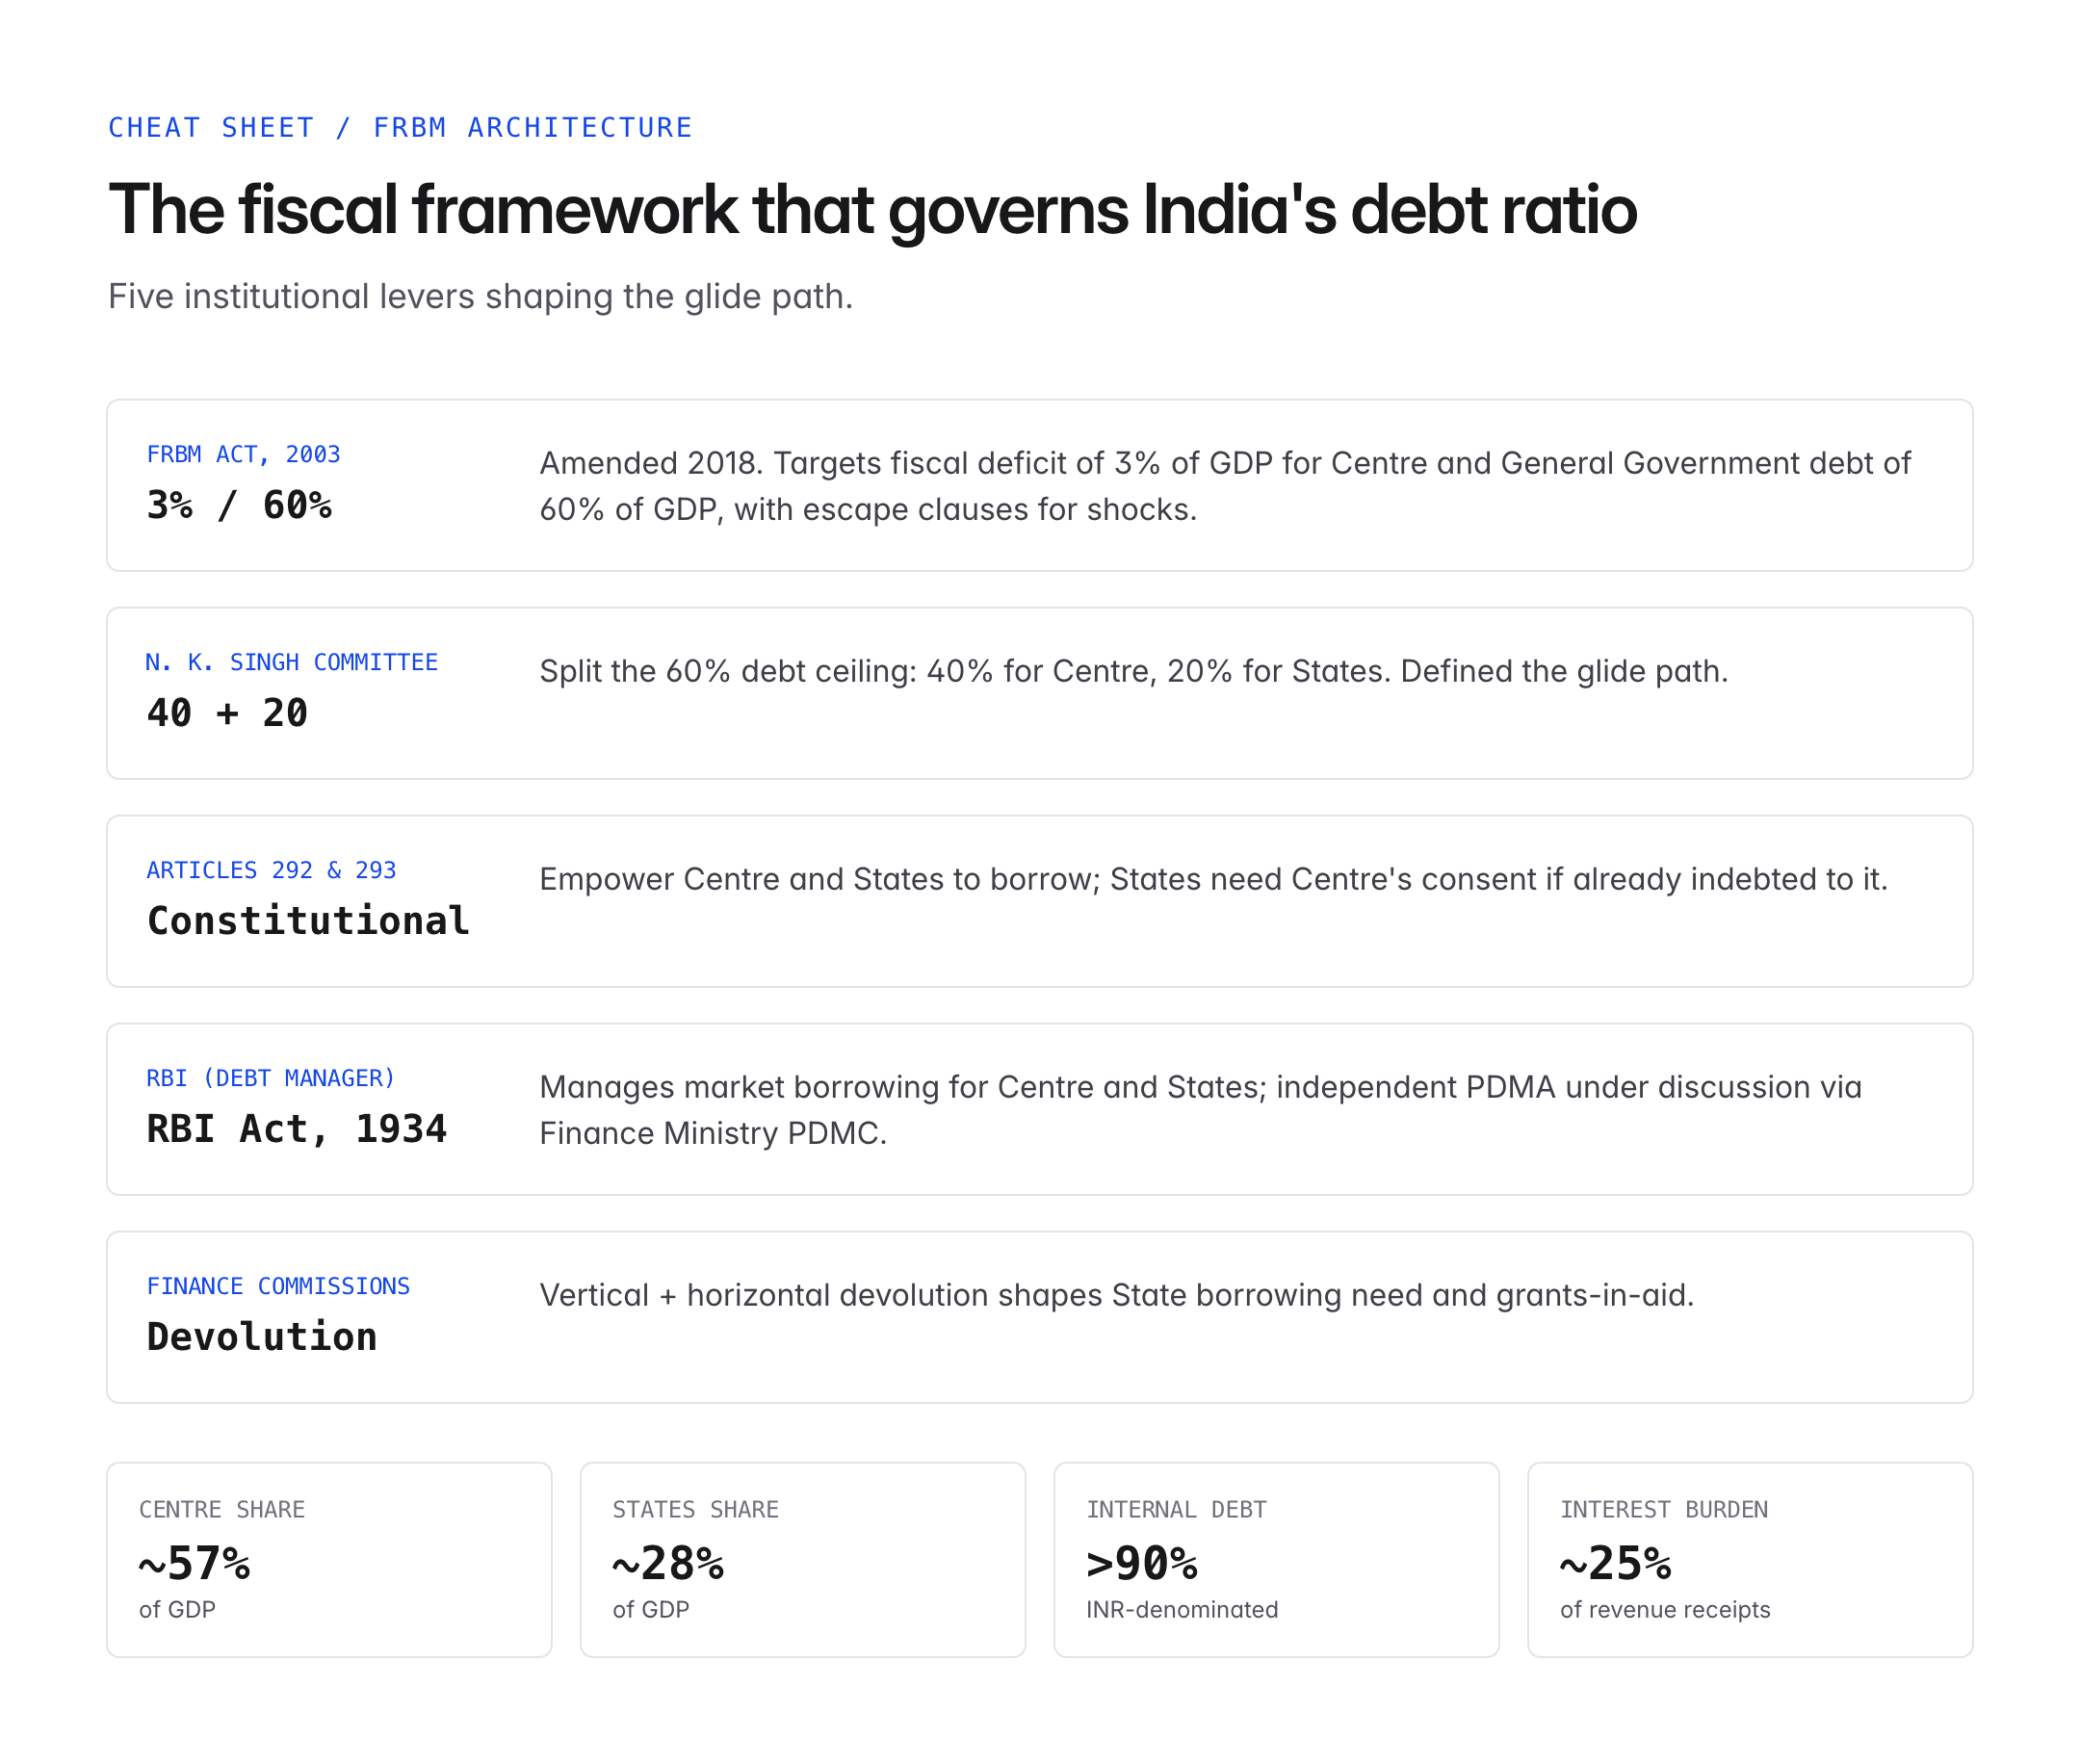
Several institutional levers shape the trajectory of the ratio.
- FRBM Act, 2003 (amended 2018): Targets a fiscal deficit of 3% of GDP for the Centre and a general government debt of 60% of GDP, with escape clauses for shocks.
- Finance Commissions: Recommend vertical and horizontal devolution that affects State borrowing needs.
- Article 292 and 293: Constitutional provisions empowering the Centre and States to borrow, with States needing Centre's consent if indebted to it.
- Public Debt Management Cell (PDMC): Housed in the Finance Ministry, working towards an independent Public Debt Management Agency (PDMA).
- RBI: Currently manages market borrowing for the Centre and States as debt manager under the RBI Act, 1934.
Medium-term strategies focus on:
- Revenue mobilisation – widening the tax base, GST rationalisation, and asset monetisation.
- Expenditure quality – shifting from revenue to capital expenditure.
- Nominal GDP growth – robust growth shrinks the ratio even with constant debt.
- State-level discipline – capping off-budget borrowings and guarantees.
UPSC Relevance
Prelims focus:
- Difference between fiscal deficit, revenue deficit, primary deficit, and debt-to-GDP.
- Provisions of the FRBM Act and the N. K. Singh Committee targets (3% fiscal deficit, 60% debt-to-GDP).
- Constitutional articles on borrowing: Article 292 (Centre) and Article 293 (States).
- Instruments of public debt: G-secs, T-Bills, SDLs, Small Savings, External Debt.
Mains GS-III angle:
- Evaluate whether India's current debt trajectory is sustainable given interest payments, growth prospects, and global financing conditions.
- Discuss the role of capital expenditure, tax-GDP ratio, and fiscal federalism in managing the ratio.
- Compare India's fiscal rules with international practice (EU Maastricht criteria, US debt ceiling).
Sample PYQ angle: "Public expenditure management is a challenge to the Government of India in the context of budget-making during the post-liberalisation period. Clarify it." Integrate debt-to-GDP dynamics, FRBM targets, and the quality of expenditure to answer such questions with analytical depth.
Tell Google you want more of this.
Add Anantam IAS as a preferred sourceOne tap, and this site shows up more often in your own Top Stories, AI Overviews and AI Mode. Remove it any time.