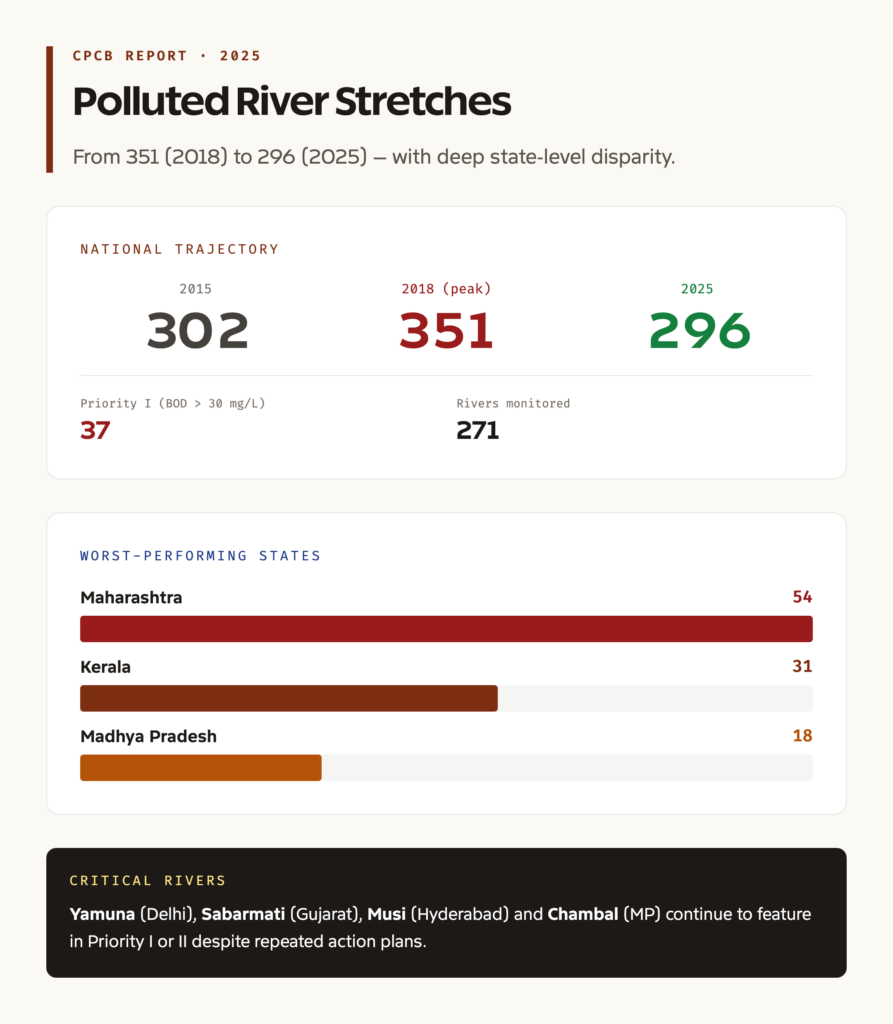
For decades the Central Pollution Control Board has tracked the chemistry of India’s rivers, station by station, river by river, season by season. The 2025 assessment, the latest in this long series, brings news that is mostly good and partly grim. The number of polluted river stretches has fallen from 351 in the 2018 baseline to 296 in 2025. The most critical category, Priority I, has dropped to 37 stretches. Yet the same report reminds us that several flagship rivers remain in the most polluted bracket and that one state, Maharashtra, accounts for more polluted stretches than the next several states put together.
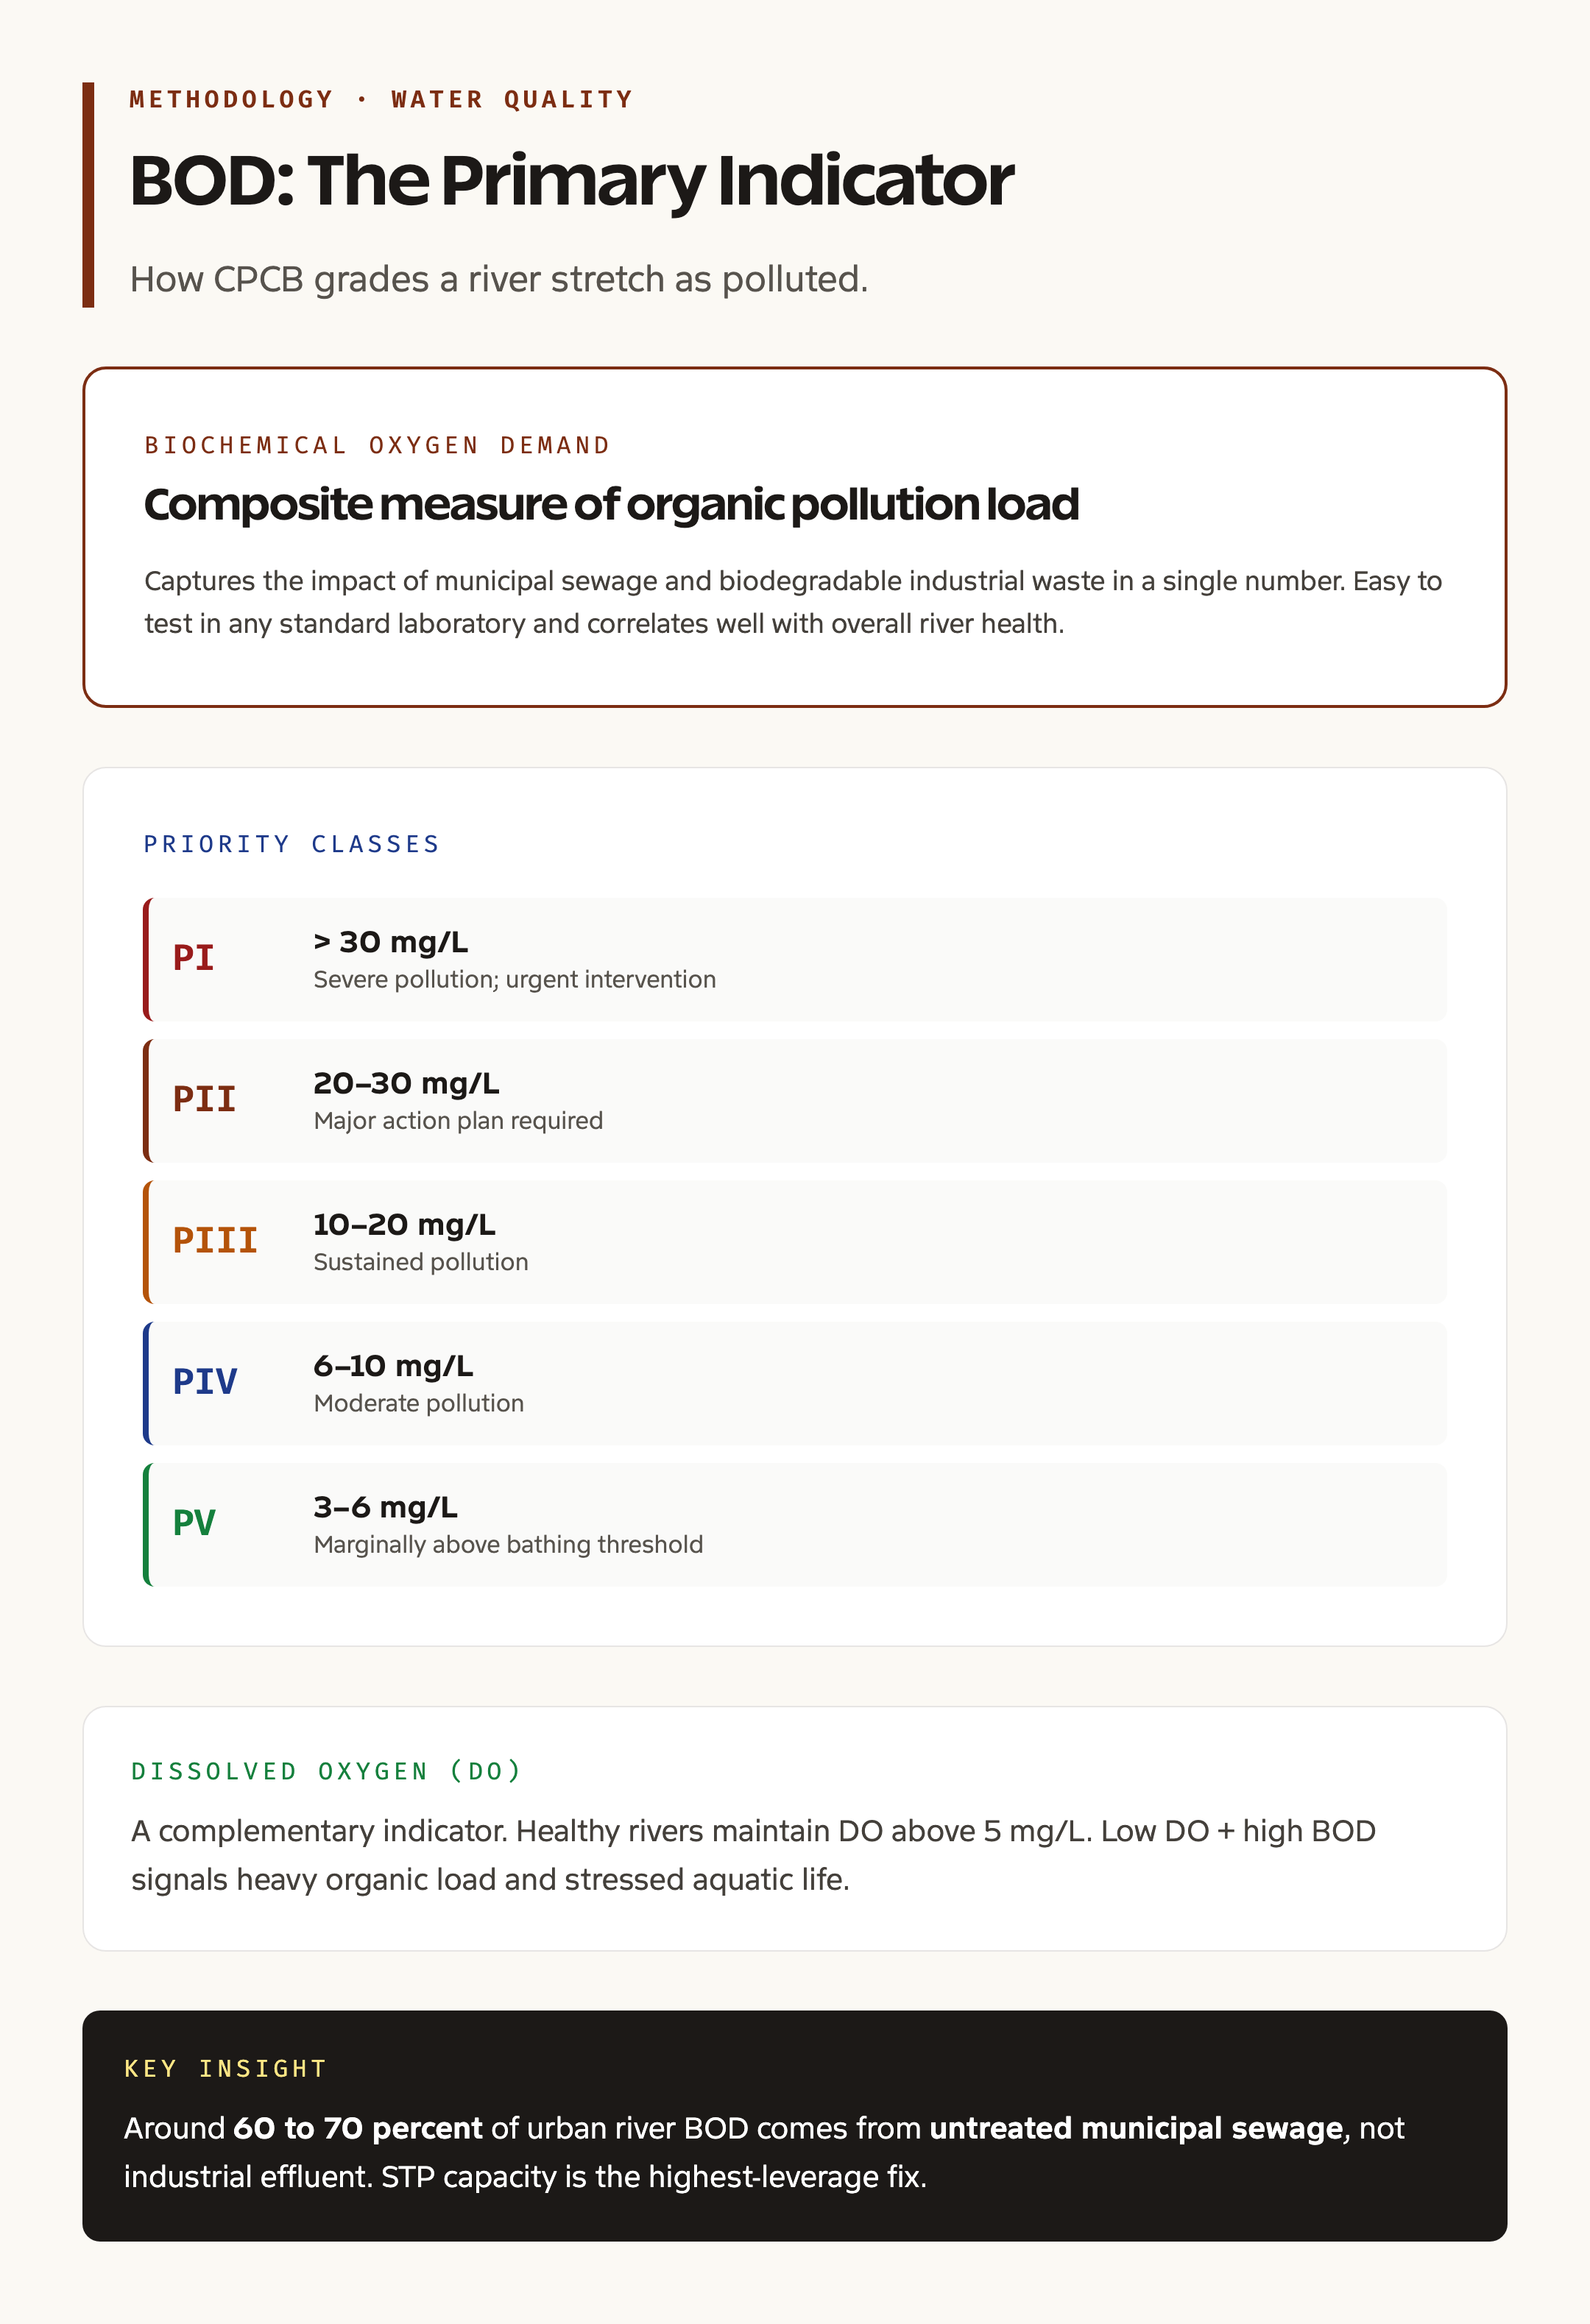
The CPCB uses a single primary indicator to grade each stretch: Biochemical Oxygen Demand, or BOD. A stretch with BOD above 3 milligrams per litre is treated as polluted, with progressively higher thresholds defining Priority categories. The methodology is standardised, repeatable, and tied to the Water (Prevention and Control of Pollution) Act, 1974. As per the latest available data, 296 stretches across 271 rivers exceed the BOD threshold and require dedicated action plans.
For UPSC, the CPCB river pollution report is a high-yield topic that connects environmental governance, water quality science, federal-state cooperation, the National Green Tribunal, and the broader question of whether India’s enforcement architecture for water pollution actually works. This guide expands every dimension of the report and its policy framework.
Quick Facts
- Issuing body: Central Pollution Control Board (CPCB)
- Statutory parent: Ministry of Environment, Forest and Climate Change
- Primary indicator used: Biochemical Oxygen Demand (BOD)
- Pollution threshold: BOD greater than 3 mg/L
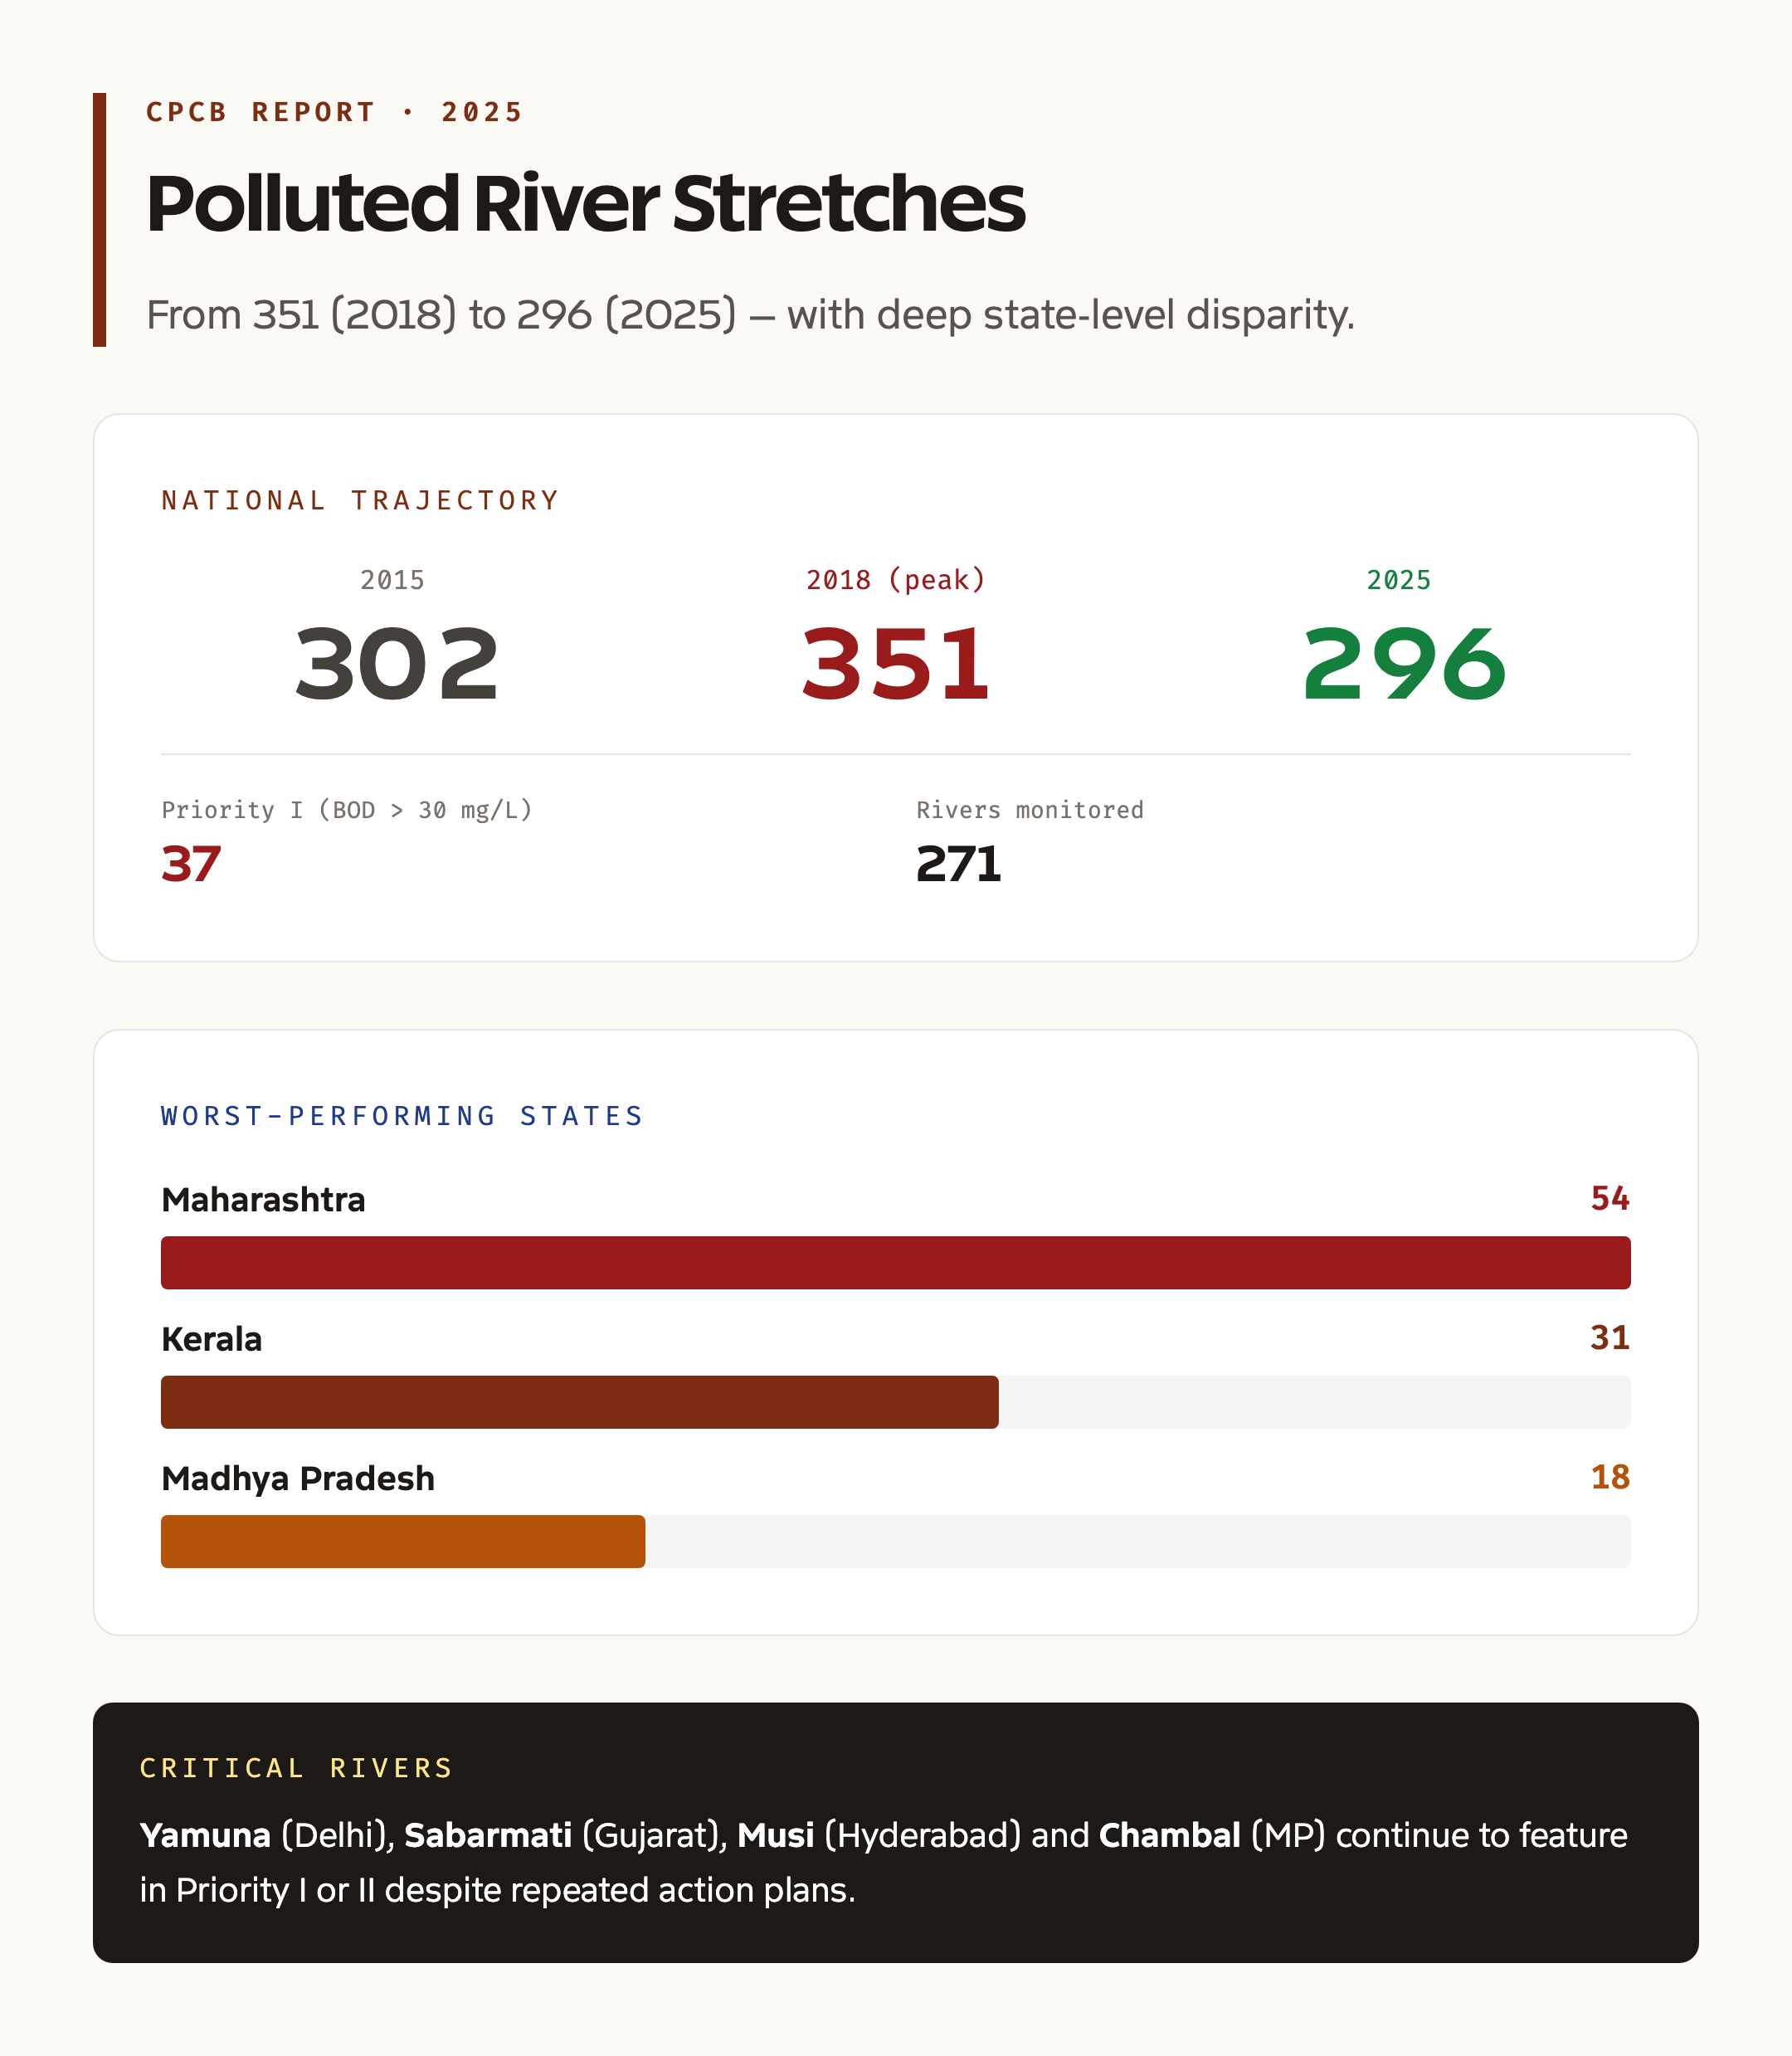
- Polluted stretches in 2018: 351
- Polluted stretches in 2025: 296 (a decline of 55 stretches)
- Critically Polluted (Priority I) stretches: Reduced to 37
- Worst-performing states: Maharashtra (54 stretches) > Kerala (31) > Madhya Pradesh (18)
- Notable critical rivers: Yamuna (Delhi), Sabarmati (Gujarat), Musi (Hyderabad), Chambal (Madhya Pradesh)
- Rivers monitored: 271 in latest assessment
- Legal backbone: Water Act, 1974; Environment Protection Act, 1986
- Action body: River Rejuvenation Committees (RRCs) in each state, mandated by NGT in 2018
- Flagship programme: Namami Gange Mission for the Ganga and tributaries
What Is the CPCB Report on River Pollution
The CPCB river pollution report is a periodic national assessment that catalogues every stretch of every monitored river in India where water quality fails to meet bathing standards. Each stretch is defined geographically, often as a length of river between two towns or two specific monitoring stations. Each stretch is assigned a Priority class from I to V, based on the maximum BOD value recorded during the assessment year.
Priority I stretches are the worst, with BOD above 30 mg/L. Priority II covers 20 to 30 mg/L. Priority III covers 10 to 20 mg/L. Priority IV covers 6 to 10 mg/L. Priority V covers 3 to 6 mg/L. The threshold of 3 mg/L is the limit at which water is considered safe for outdoor bathing without disinfection. Anything above that signals that organic pollution loads exceed the river’s natural capacity to break them down.
The 2025 report draws on data from the National Water Quality Monitoring Programme, which CPCB runs jointly with State Pollution Control Boards. Sampling stations measure BOD, dissolved oxygen, pH, faecal coliform, total dissolved solids, and several other parameters. The assessment compares the latest two years of monitoring data against the 2018 baseline, which itself was the trigger for the National Green Tribunal to mandate state-level River Rejuvenation Committees. The trajectory from 351 to 296 polluted stretches is therefore a direct measure of seven years of action under that framework.
Background and Historical Context
India began monitoring river water quality systematically in the late 1970s, soon after the Water (Prevention and Control of Pollution) Act, 1974 created the CPCB and the State Pollution Control Boards. Early reports identified a small number of grossly polluted stretches, mostly downstream of major industrial cities. The Ganga Action Plan launched in 1985 was the country’s first targeted river clean-up programme, and it set the template for later efforts.
The Yamuna Action Plan followed in the early 1990s. Various state-level plans for the Sabarmati, Musi, Damodar, and other rivers followed in successive decades. Despite these scattered plans, monitoring data continued to show stagnant or worsening conditions on many rivers, especially urban stretches where untreated municipal sewage was the dominant load.
The 2015 baseline assessment by CPCB identified 302 polluted stretches. The 2018 update raised the figure to 351, reflecting both better monitoring coverage and worsening conditions on several rivers. That escalation is what triggered the National Green Tribunal in 2018 to direct each state to constitute a River Rejuvenation Committee with statutory time-bound action plans.
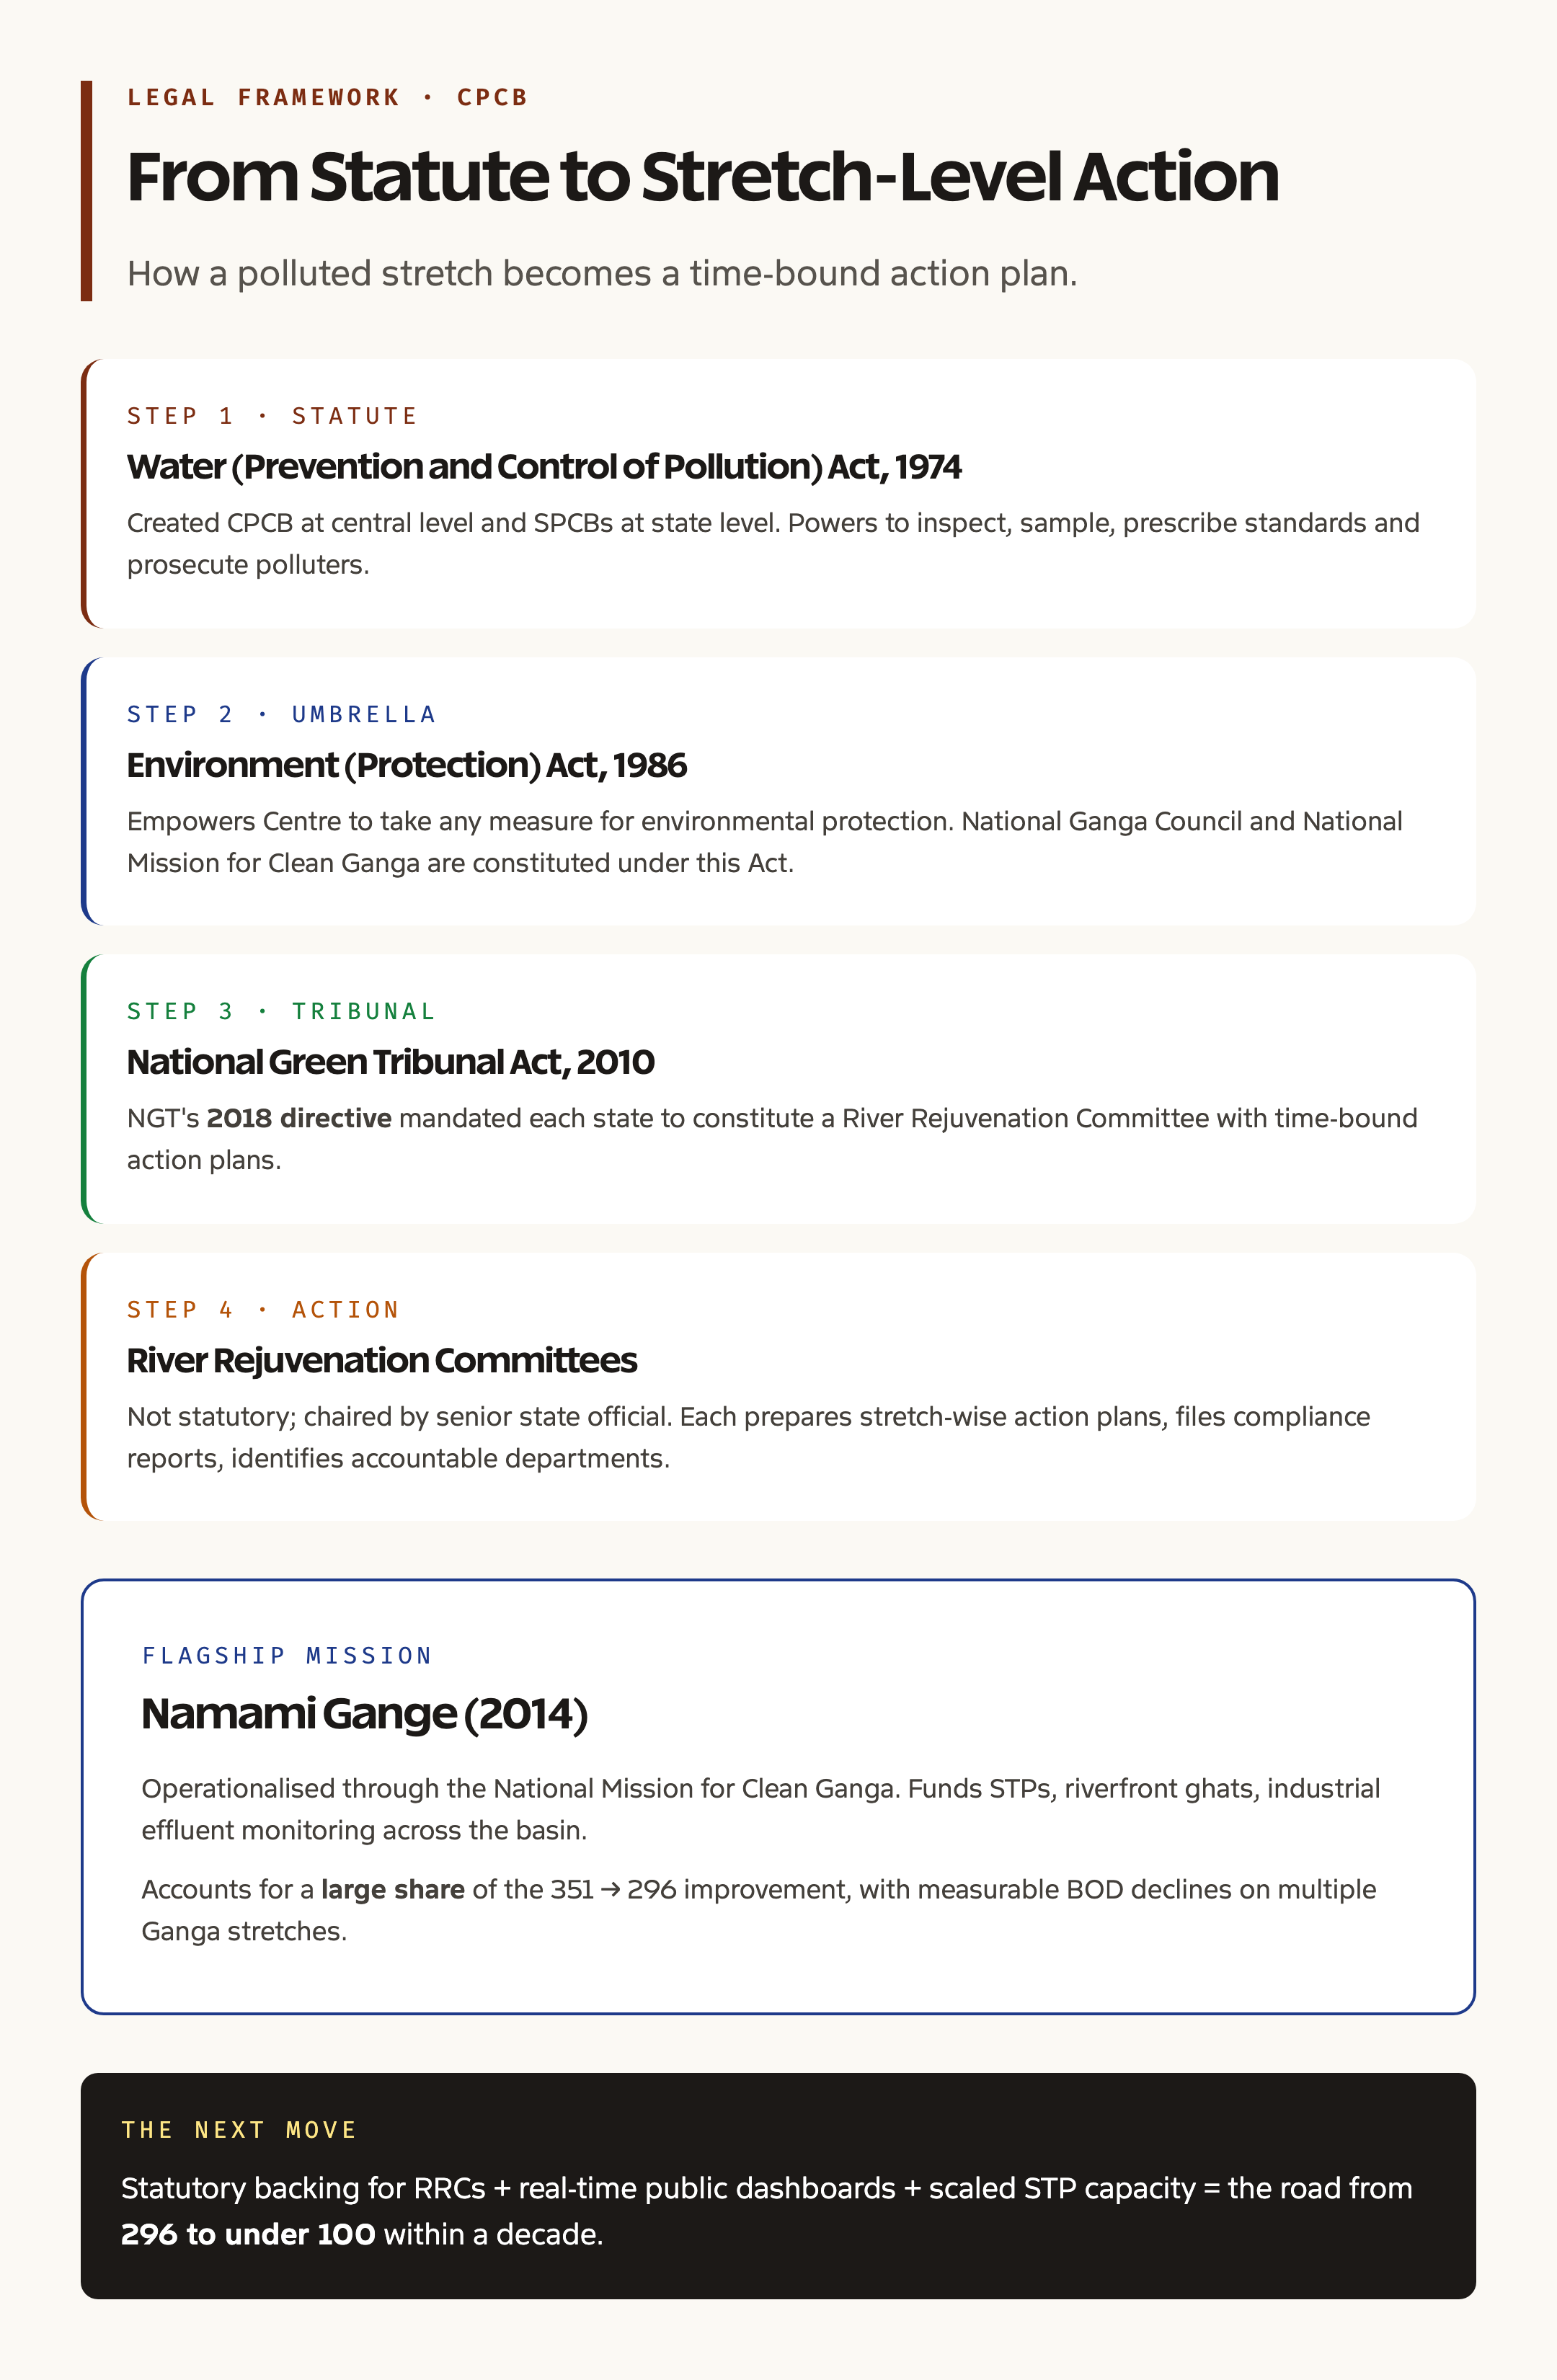
The Namami Gange Mission, launched in 2014 with a flagship budget commitment, was operationalised under the National Mission for Clean Ganga and the National Ganga Council, both constituted under the Environment Protection Act, 1986. Namami Gange built sewage treatment plants, riverfront ghats, and industrial effluent monitoring across the basin. Its results have been visible in measurable BOD declines on specific Ganga stretches and form a significant part of the 2025 improvement.
Key Provisions of the Legal Framework
The legal architecture under which CPCB operates rests on a combination of statutes and tribunal directives.
The Water (Prevention and Control of Pollution) Act, 1974 is the primary legislation. It established CPCB at the central level and SPCBs at the state level, gave them the power to inspect industrial premises, sample effluents, prescribe standards, and prosecute polluters. It is the foundational instrument for everything in this space and forms a core item in the broader environmental laws in India framework.
The Environment (Protection) Act, 1986 acts as an umbrella law. It empowers the Central Government to take any measure necessary for environmental protection, including constituting expert bodies. The National Ganga Council, the National Mission for Clean Ganga, and various rules on industrial effluent are all created under this Act.
The National Green Tribunal Act, 2010 established the NGT, which has emerged as the most active enforcement body for environmental compliance. Its 2018 order requiring River Rejuvenation Committees was a direct response to the CPCB’s 351-stretch finding and continues to drive state-level action plans. The 2018 judicial framework has also shaped state-level handling of river pollution disputes such as those documented in the Yamuna toxic froth phenomenon.
The River Rejuvenation Committee mechanism deserves a closer look. RRCs are not statutory bodies. They were created administratively in response to the NGT order and chaired by a senior state official. Each committee is required to prepare a time-bound action plan for every polluted stretch in its state, file periodic compliance reports, and identify accountable departments. Function-wise, RRCs sit between CPCB monitoring data and on-ground state agency action.
Various sectoral rules under the Environment Protection Act, including the Industrial Effluent Standards, Sewage Treatment Plant Discharge Standards, and the Hazardous Waste Management Rules, add operational detail to the broader pollution control mandate.
Why It Matters
The river pollution report carries weight beyond environment circles for several reasons.
Public health is the first reason. Polluted river water enters drinking water supply at thousands of intake points across the country. High BOD and faecal coliform readings translate directly into gastrointestinal disease burden, especially in monsoon months when treatment plants are overwhelmed.
Agricultural productivity is the second reason. Wastewater irrigation around urban fringes is widespread. Heavy metals, untreated industrial effluent, and pathogens enter the food chain via leafy vegetables and fodder crops. The Musi river around Hyderabad and the Yamuna around Delhi are textbook cases where wastewater irrigation has scaled to tens of thousands of farmers.
Tourism and cultural value is the third reason. The Ganga, the Yamuna, and many smaller rivers carry religious, cultural, and tourism significance. Sustained pollution erodes that value and damages associated economies. Linked topics include river systems in India and the broader water resources India story.
Climate adaptation is the fourth reason. Pollution-loaded rivers are more vulnerable to drought because residual flow concentrates pollutants further. They are also more vulnerable to flooding because polluted sediments redistribute toxic loads onto floodplains. Cleaner rivers therefore deliver climate resilience as a side benefit.
International benchmarking is the fifth reason. India’s commitments under Sustainable Development Goal 6 on clean water and sanitation are tracked against measurable pollution data. The CPCB report is the primary domestic dataset that informs SDG 6 reporting at the United Nations level.
Detailed Analysis: Reading the 2025 Numbers
A 55-stretch decline from 351 to 296 looks meaningful but needs interpretation.
The decline is real. Reduction of Priority I stretches to 37 indicates that the worst-of-the-worst category has shrunk. Targeted action plans on rivers like the Ganga, parts of the Brahmani, and certain Krishna basin stretches have lifted those segments out of the gravest pollution band.
The headline mask state-level disparities. Maharashtra alone accounts for 54 stretches, more than any other state. Kerala follows at 31 and Madhya Pradesh at 18. Maharashtra’s industrial density, large urban sewage volumes, and the Mula-Mutha-Bhima-Krishna corridor create a pollution problem that even strong action plans struggle to dent at scale.
Specific rivers remain critical. The Yamuna in Delhi, the Sabarmati in Gujarat, the Musi in Hyderabad, and the Chambal in Madhya Pradesh continue to figure in critical Priority I or Priority II categories. The Yamuna case is especially notable because the Delhi stretch carries massive untreated sewage loads despite decades of action plans.
Action plan compliance is uneven. Some states have published detailed RRC reports with milestones and budget allocations. Others have published cursory documents with little operational substance. The variation is part of the reason national-level improvements remain modest relative to the size of the challenge.
Industrial effluent contributes a smaller share of total BOD than untreated sewage. National data consistently shows that around 60 to 70 percent of urban river pollution comes from municipal sewage, while industrial effluent accounts for the remainder. This finding shapes the dominant action priority: build and operate sewage treatment plants at scale.
Comparative Snapshot: Then and Now
A simple comparison highlights the trajectory.
In 2015, CPCB identified 302 polluted stretches. In 2018, the number rose to 351. In 2025, it dropped to 296. The arc shows a worsening between 2015 and 2018, followed by a reversal between 2018 and 2025. Most of the improvement comes from upgrading Priority I and Priority II stretches into less severe categories rather than fully rehabilitating them out of the polluted list.
Major flagship rivers tell mixed stories. The Ganga has shown measurable BOD improvements on several stretches under Namami Gange, with several monitoring stations now consistently below the 3 mg/L threshold. The Yamuna remains in critical condition on its Delhi stretch despite repeated action plans. The Sabarmati’s pollution profile is dominated by Ahmedabad’s combined sewage and industrial discharge, with only modest improvement reported. The Musi has seen marginal improvement after Hyderabad’s expanded sewage treatment infrastructure but remains in Priority II.
State-level rankings should be read with population and industry adjustments. Maharashtra’s high count partly reflects high monitoring density and large urban populations. Smaller states with fewer monitoring stations may show fewer polluted stretches simply because fewer stretches are sampled. The headline state rank therefore captures both real conditions and monitoring intensity.
Challenges in River Pollution Control
Several persistent challenges explain why progress has been gradual.
Sewage treatment capacity remains short. National installed capacity is significantly below the daily volume of urban wastewater generated. Even where plants exist, operational uptime is often poor due to power failures, maintenance gaps, and revenue shortfalls.
Enforcement is uneven. SPCBs across states vary widely in technical capacity, staffing, and political backing. A municipal corporation that is the largest polluter is also often a key political stakeholder, which weakens enforcement.
Data quality varies. Some monitoring stations report data inconsistently, with gaps during monsoon months when contamination is often highest. CPCB has steadily expanded automatic real-time monitoring stations on critical rivers, but coverage is still partial.
Industry compliance has improved at large units but remains weak in informal clusters. Tanneries, dye houses, and small chemical units around cities like Kanpur, Vapi, and Tiruppur continue to discharge untreated effluents, often through unauthorised drains.
Groundwater interaction adds another layer. Polluted river water recharges aquifers along the floodplains, contaminating drinking water wells. This connection ties river pollution policy directly to the larger groundwater crisis in India and demands integrated management.
Citizen reporting and citizen science remain underused. India lacks a nationwide citizen-reporting platform for water pollution incidents that feeds directly into SPCB enforcement queues.
Prelims Pointers
- CPCB stands for Central Pollution Control Board, established under the Water Act, 1974
- The primary indicator used to assess river pollution is Biochemical Oxygen Demand (BOD)
- A river stretch is treated as polluted if BOD exceeds 3 mg/L
- Priority I stretches have BOD above 30 mg/L
- The 2018 baseline showed 351 polluted stretches; the 2025 report shows 296
- Critically Polluted (Priority I) stretches in 2025: 37
- Worst-performing state: Maharashtra (54 stretches), followed by Kerala and Madhya Pradesh
- Notable critical rivers: Yamuna, Sabarmati, Musi, Chambal
- The Water Act, 1974 created CPCB and the SPCBs
- The Environment Protection Act, 1986 is the umbrella law
- The National Green Tribunal mandated River Rejuvenation Committees in 2018
- RRCs are not statutory bodies
- The National Ganga Council and National Mission for Clean Ganga are constituted under the EPA, 1986
- Namami Gange Mission was launched in 2014
Mains Practice Questions
- The 2025 CPCB report shows a measurable decline in polluted river stretches but several flagship rivers remain critically polluted. Critically examine the institutional and operational gaps in India’s river pollution control architecture. (250 words)
- Discuss the role of the National Green Tribunal in driving river rejuvenation in India, with particular reference to the River Rejuvenation Committee framework. (250 words)
- Explain the use of Biochemical Oxygen Demand as the primary indicator for river pollution monitoring in India. What are its strengths and limitations as a single composite metric? (150 words)
Way Forward
A few coordinated steps would compound the gains shown in the 2025 report.
A nationwide push to scale sewage treatment plant capacity to match urban wastewater generation, with clear milestones for each tier-1 and tier-2 city, is the highest-leverage intervention. The financial outlay required is large but offers the largest pollution reduction per rupee.
Real-time monitoring expansion across all polluted stretches, with public dashboards showing live BOD and dissolved oxygen levels, would dramatically increase accountability. CPCB has begun this work; the pace needs to triple.
Strengthening RRC accountability by giving each committee statutory backing, dedicated funding, and a transparent compliance dashboard would convert a paper framework into an operational engine.
Enforcement upgrades for SPCBs through autonomy in hiring, technical training, and digital case management would close the gap between detection and prosecution. The model should mirror the operational improvements seen at the Central Ground Water Authority and other autonomous environmental bodies.
Watershed-level integrated planning that connects pollution control with water flow management, groundwater recharge, and floodplain protection would treat each river as one system rather than as a series of isolated stretches.
Citizen reporting platforms with rapid SPCB response timelines, modelled on successful examples in some Western Ghats states, would convert citizens into a force multiplier for monitoring.
International best practice exchange, especially with countries that have managed urban river clean-ups at scale such as the Thames in London or the Rhine in Western Europe, would import techniques and operational templates that India can adapt.
The trajectory from 351 to 296 polluted stretches shows that focused effort delivers measurable results. The challenge now is to convert these scattered improvements into a national-scale shift before climate change and urban expansion overwhelm the gains.
Frequently Asked Questions
What is the CPCB report on river pollution?
It is a periodic assessment by the Central Pollution Control Board that lists every stretch of every monitored river in India where water quality fails the bathing standard. Each stretch is assigned a Priority class based on its maximum BOD value.
What does the 2025 report say about polluted river stretches?
The 2025 report shows the number of polluted stretches has fallen to 296 from 351 in 2018. Critically Polluted (Priority I) stretches have dropped to 37. Maharashtra leads with 54 polluted stretches, followed by Kerala at 31 and Madhya Pradesh at 18.
Why does CPCB use BOD as the primary indicator?
Biochemical Oxygen Demand is a composite measure of organic pollution load. It captures the impact of municipal sewage and biodegradable industrial waste in a single number, is easy to test in any standard laboratory, and correlates well with overall river health for most polluted Indian rivers.
Which Indian rivers are most polluted right now?
Critical rivers in the latest assessment include the Yamuna in Delhi, the Sabarmati in Gujarat, the Musi in Hyderabad, and the Chambal in Madhya Pradesh. Several smaller urban rivers in Maharashtra and Kerala also figure in the top critical list.
What is a River Rejuvenation Committee?
A River Rejuvenation Committee is a state-level body created in 2018 following an order of the National Green Tribunal. Each RRC must prepare and execute time-bound action plans for the polluted river stretches in its state. RRCs are not statutory bodies and operate as administrative committees.
What is the legal basis of the CPCB?
The Central Pollution Control Board was established under the Water (Prevention and Control of Pollution) Act, 1974. The Act gives the Board powers to inspect industrial premises, prescribe standards, sample effluents, and prosecute violators.
What role does Namami Gange play in river pollution control?
Namami Gange is the flagship clean-up mission for the Ganga basin, launched in 2014 and operationalised through the National Mission for Clean Ganga. It funds sewage treatment plants, riverfront development, and industrial effluent control on the Ganga and key tributaries, and it accounts for a large share of the recent BOD improvements.
Why is Maharashtra the worst-performing state?
Maharashtra hosts a large urban population, dense industrial activity along the Mula-Mutha-Bhima-Krishna corridor, and a comparatively dense river-monitoring grid. The combination of real pollution and high monitoring intensity drives its top rank in the polluted stretch list.
What is the difference between Priority I and Priority V stretches?
Priority I stretches have BOD above 30 mg/L, indicating severe pollution. Priority V stretches have BOD between 3 and 6 mg/L, marginally above the bathing threshold. The classification helps states allocate effort: Priority I stretches need urgent intervention, while Priority V stretches need monitoring and modest action.
How does the CPCB report connect to UPSC?
It connects to environmental governance, the Water Act, the Environment Protection Act, the NGT framework, river systems, water quality science, and Sustainable Development Goal 6. It pairs well with topics like Namami Gange, the Yamuna pollution case, and the CPCB-SPCB institutional setup.
Tell Google you want more of this.
Add Anantam IAS as a preferred sourceOne tap, and this site shows up more often in your own Top Stories, AI Overviews and AI Mode. Remove it any time.