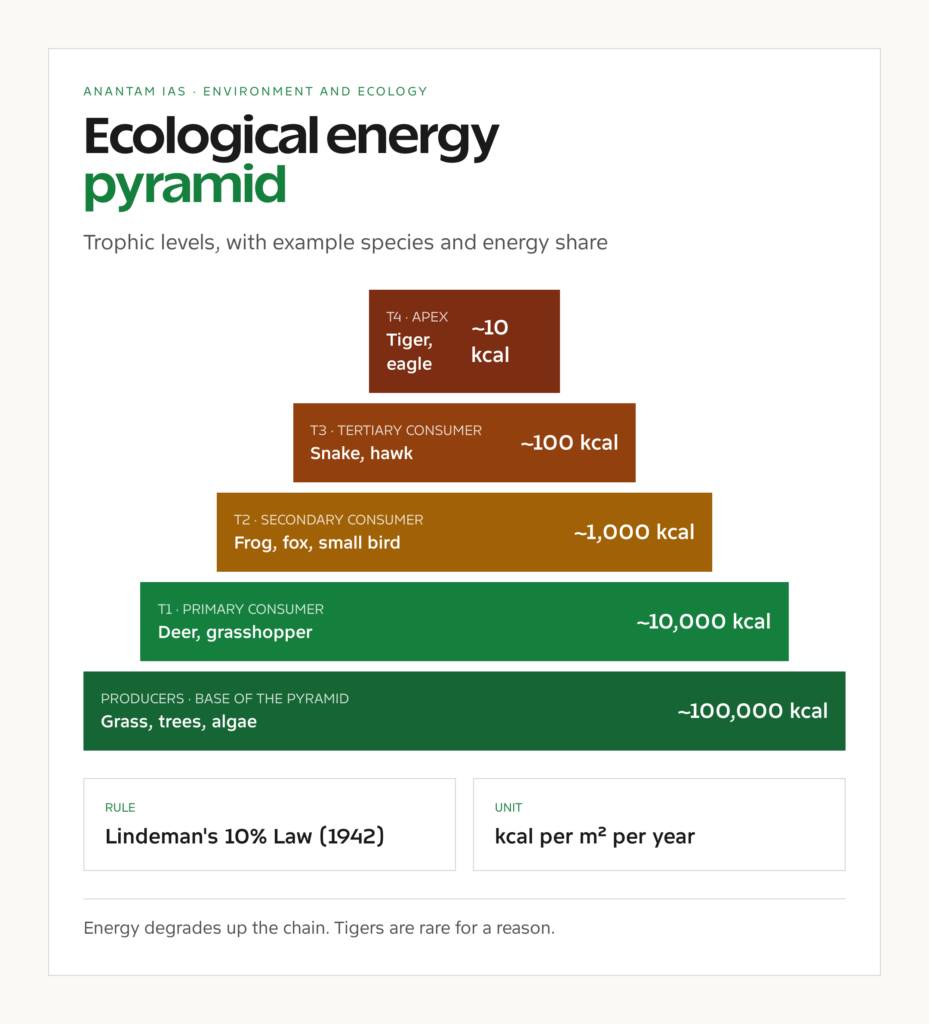
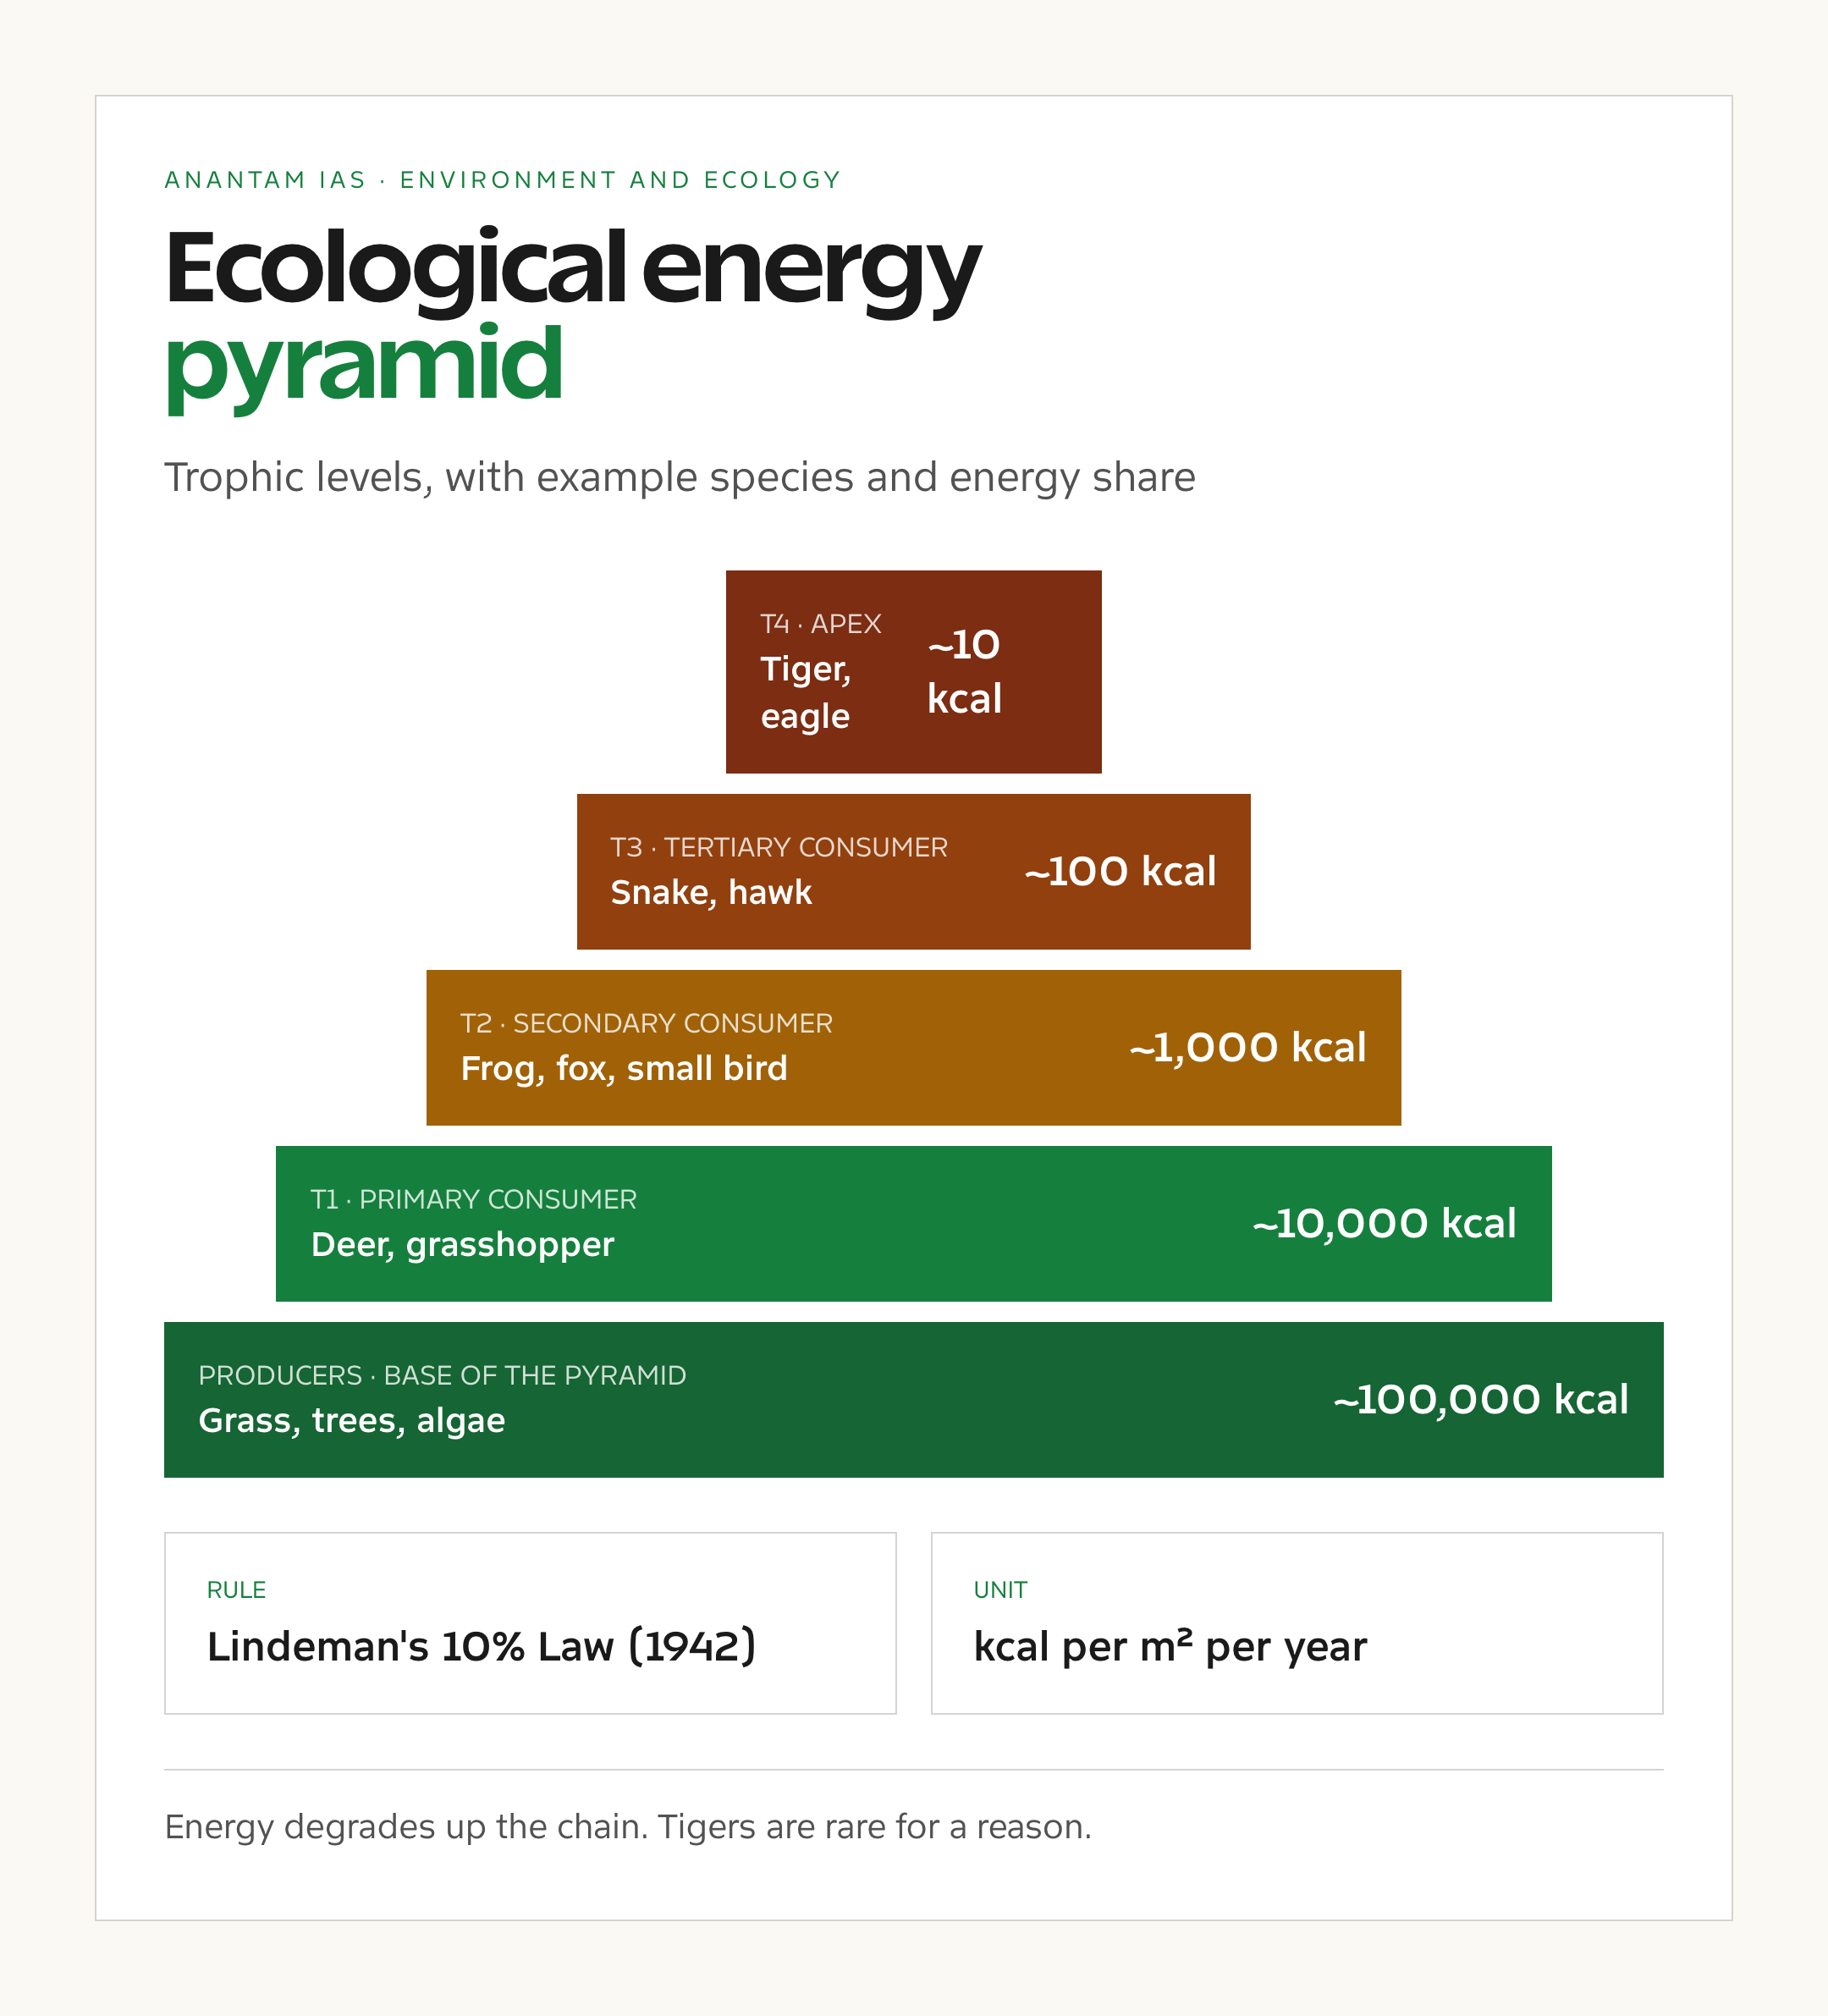
The ecological energy pyramid is the simplest way to picture how energy moves through an ecosystem and why every food chain is short. Plants and other producers capture sunlight, herbivores eat plants, carnivores eat herbivores, and a small number of apex predators eat them. At each step about 90 percent of the energy is lost as heat, leaving only roughly 10 percent for the next trophic level. That single rule, formalised by the American limnologist Raymond Lindeman in 1942, is why grass-fed cattle can support far fewer wolves than there are cattle, why tigers are always rare, and why pyramids in ecology generally have a wide base and a narrow tip.
For UPSC aspirants, the ecological energy pyramid is core Environment material. It cuts across the General Studies III environment syllabus, the optional subject papers in biology and geography, and even Mains essay prompts on biodiversity and climate. It also explains the basic logic behind food security planning, fisheries management, and trophic cascades in conservation biology.
This piece walks through the three kinds of ecological pyramid (numbers, biomass, energy), the 10 percent law, the trophic levels in detail, where pyramids can be inverted, and why the concept matters for India’s protected areas and wildlife policy.
Quick Facts at a Glance
- Concept: Graphical representation of energy, biomass, or numbers across trophic levels in an ecosystem
- Trophic levels: Producers (T1), primary consumers (T2), secondary consumers (T3), tertiary consumers (T4), apex predators (T5)
- Key rule: Lindeman’s 10% Law, 1942
- Three types: Pyramid of numbers, pyramid of biomass, pyramid of energy
- Producers: Green plants, algae, photosynthetic bacteria, chemosynthetic bacteria
- Primary consumers: Herbivores (deer, cattle, grasshoppers)
- Secondary consumers: Small carnivores (frogs, small birds, foxes)
- Tertiary consumers: Larger carnivores (snakes, hawks, leopards)
- Apex predators: Top of the food chain (tigers, lions, large sharks, eagles)
- Energy unit: Generally measured in kilocalories per square metre per year (kcal/m²/yr)
- Energy pyramid: Always upright; cannot be inverted
- Biomass pyramid: Usually upright; can be inverted in aquatic ecosystems
- Pyramid of numbers: Can be upright, inverted, or irregular depending on the ecosystem
What an Ecological Energy Pyramid Actually Is
An ecological energy pyramid is a vertical stack of bars or steps where each layer shows the amount of energy available at one trophic level of an ecosystem. The widest bar at the base represents producers; bars get narrower as you go up because energy is lost at every transfer. The pyramid is a way of drawing the second law of thermodynamics as it applies to living systems: no energy transfer is fully efficient, and the rest leaves the system as heat.
There are three closely related pyramid representations. The pyramid of energy plots the rate at which energy flows through each level, normally in kcal per square metre per year. The pyramid of biomass plots the standing stock of living tissue at each level, normally in grams per square metre. The pyramid of numbers simply counts individual organisms at each level. Energy is the most reliable representation because it accounts for both turnover and standing stock; biomass and numbers can deceive in ecosystems where small, fast-reproducing organisms support large populations of slower consumers.
Background and Historical Context
Who Built the Idea
The idea of organising organisms into trophic levels goes back to the British ecologist Charles Elton in his 1927 book Animal Ecology, where he introduced the concept of the “food cycle” and the “pyramid of numbers.” Elton’s pyramid simply observed that there are usually many more small herbivores than large carnivores. It was a description, not a quantitative law.
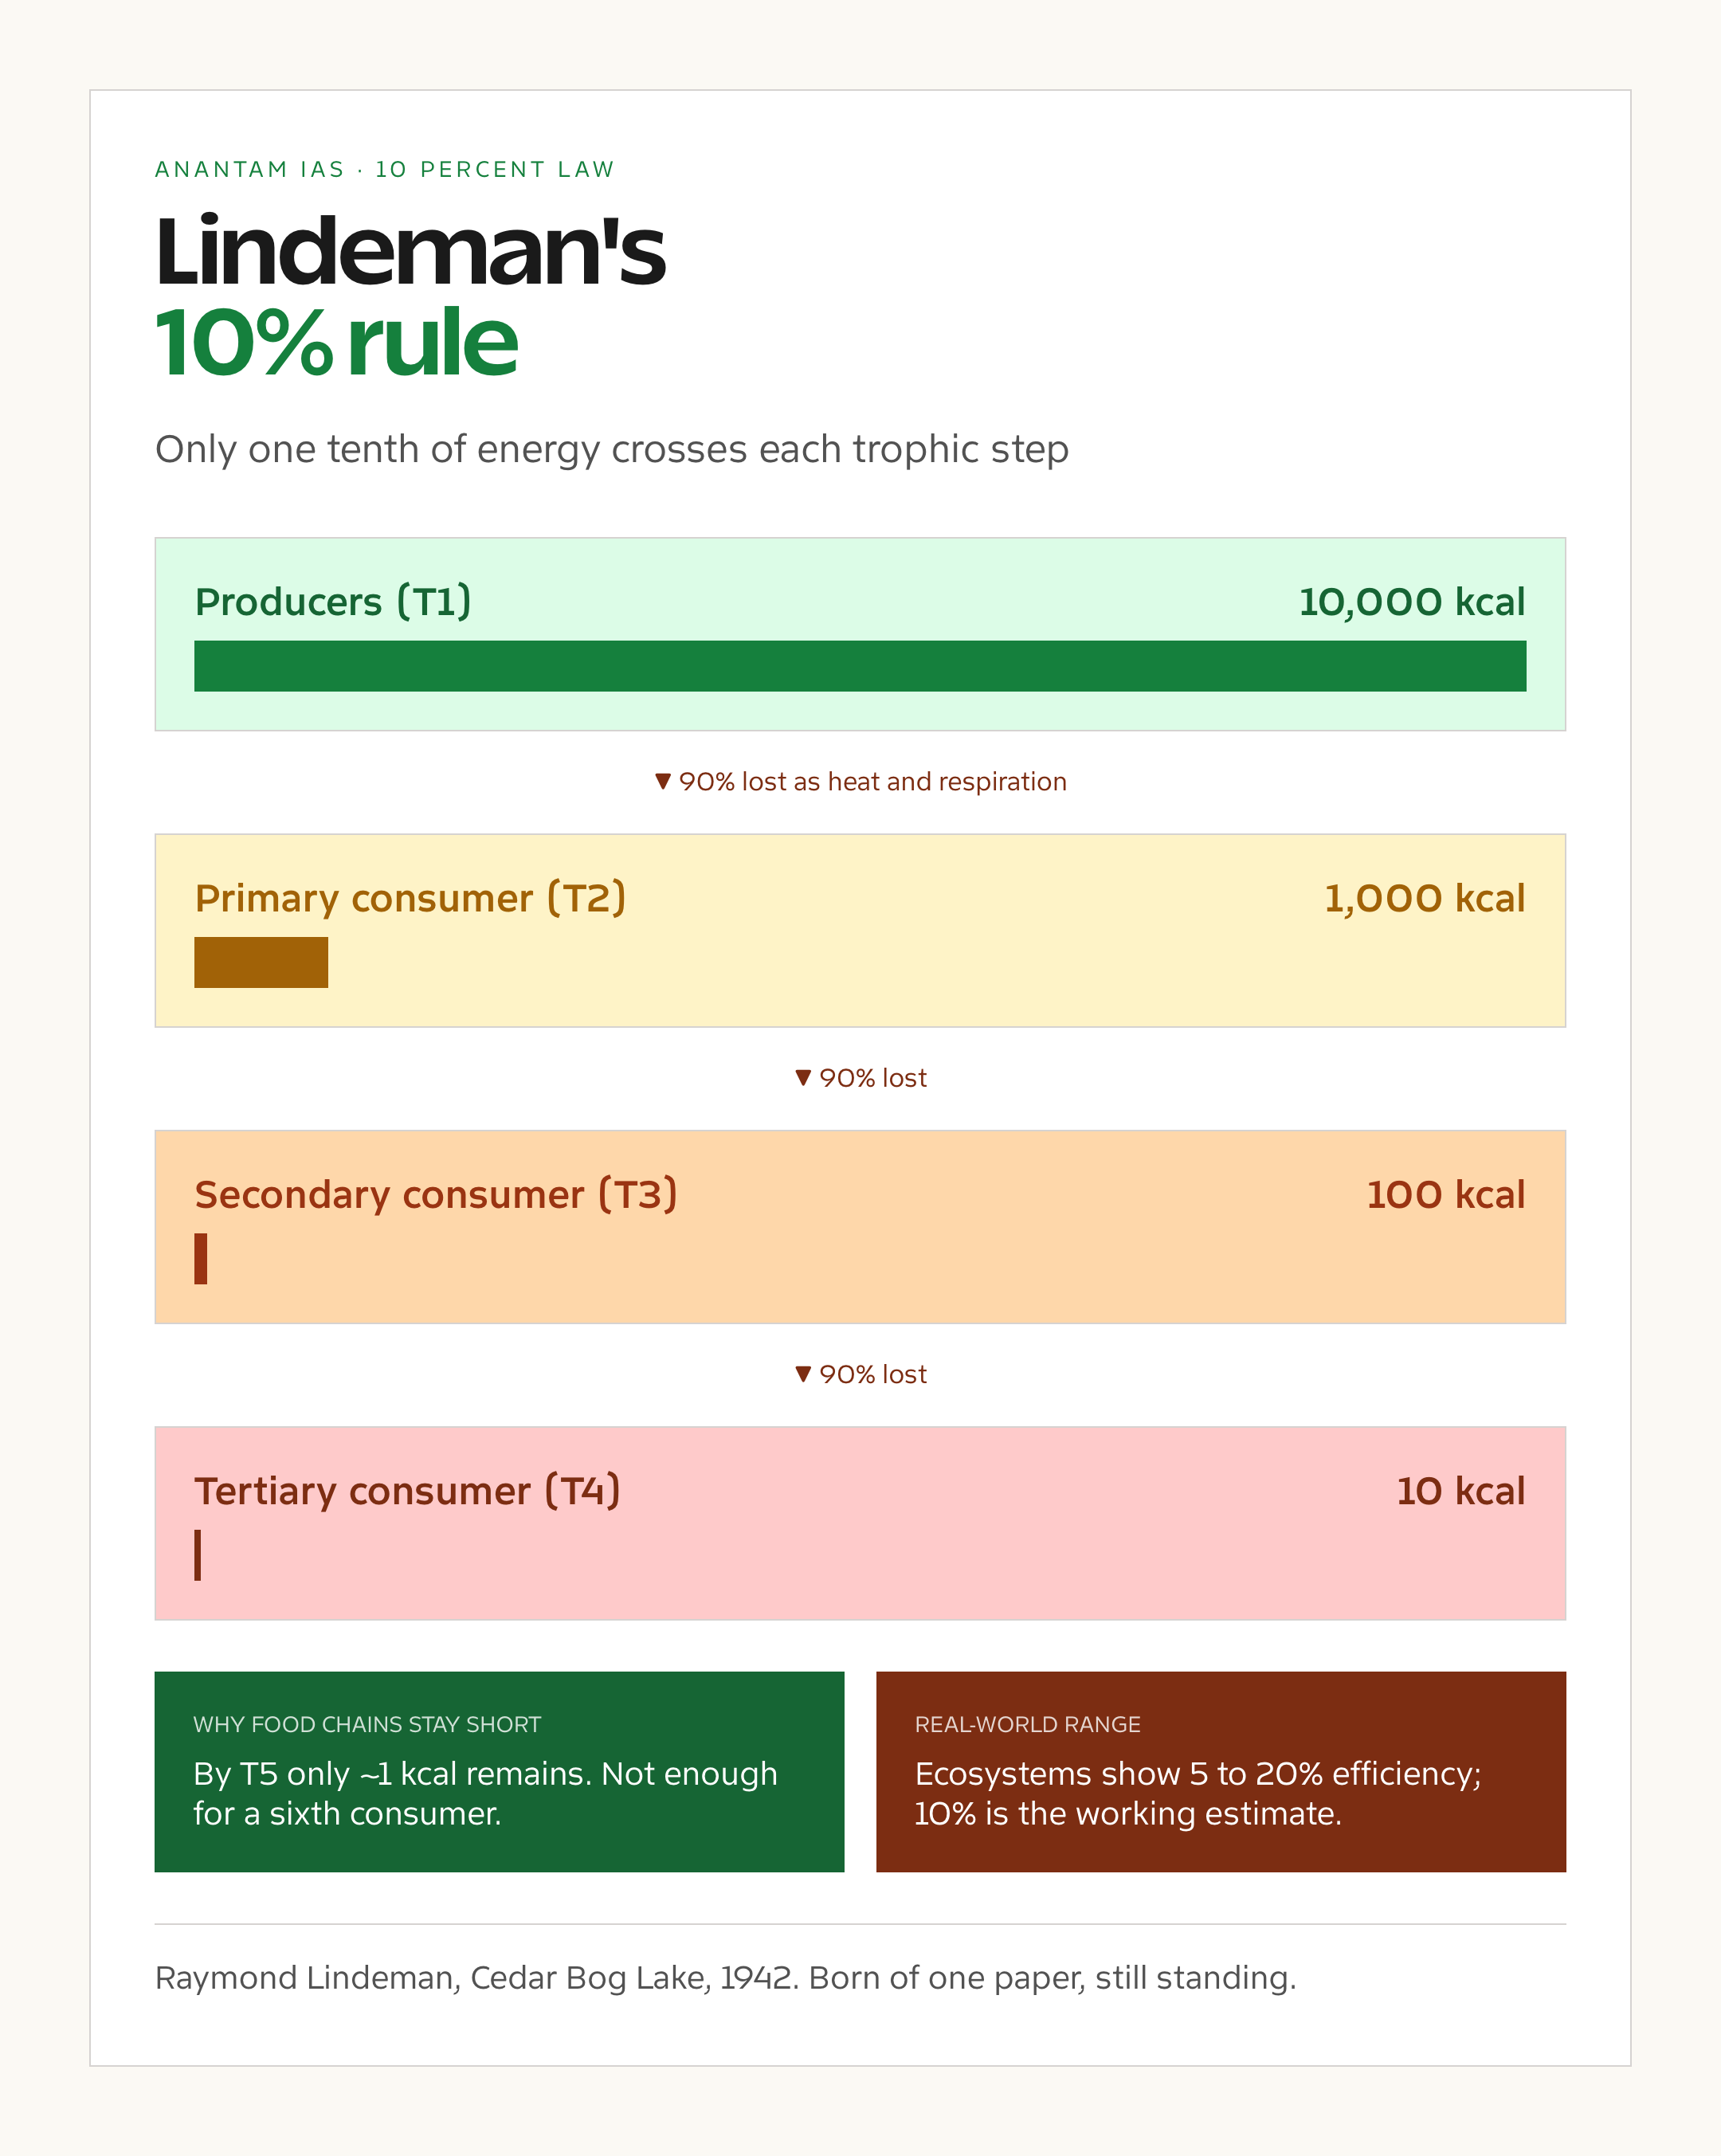
The quantitative leap came in 1942 from Raymond Lindeman, an American ecologist working at Cedar Bog Lake in Minnesota. In a single seminal paper, The Trophic-Dynamic Aspect of Ecology, Lindeman measured energy at each level of the lake’s food web and showed that energy transfer efficiency between trophic levels hovered around 10 percent. The Lindeman 10% Law has been refined since then; real ecosystems show transfer efficiencies between 5 and 20 percent, with 10 percent as a useful planning number for textbooks and policy work.
Lindeman died at 27 just before his paper was published. His mentor G. Evelyn Hutchinson saw it through to print, and within a decade Lindeman’s framework had become the operating model for the whole field of ecosystem ecology.
Key Features of the Ecological Energy Pyramid
The ecological energy pyramid has a small number of features that the UPSC examiner can frame questions around.
- Always upright in energy terms: No matter how strange the ecosystem, energy at level T2 cannot exceed energy at T1 because energy is conserved and degraded at every step.
- Cumulative energy loss: If T1 has 10,000 kcal/m²/yr, T2 has roughly 1,000, T3 has 100, T4 has 10, and T5 has 1.
- Length of food chains limited: Because of cumulative loss, ecological food chains rarely exceed four or five steps. There is simply not enough energy to support a sixth predator.
- Detritus food chain runs parallel: Dead plant and animal matter feeds decomposers (bacteria, fungi, detritivores) whose energy flow is often as large as the grazing food chain.
- Producers can be primary or chemosynthetic: Surface ecosystems run on photosynthesis; deep-sea hydrothermal vent ecosystems run on chemosynthesis using sulphur compounds.
- Standing stock and turnover are different: A small biomass of fast-reproducing phytoplankton can support a larger biomass of slow-growing zooplankton; this is why biomass pyramids can sometimes invert in aquatic systems.
Why the Ecological Energy Pyramid Matters
The pyramid is not just a teaching device. It governs real conservation decisions. The fact that apex predators sit on a thin sliver of available energy is why tigers, snow leopards, gharials, and great Indian bustards exist in small numbers and are vulnerable to habitat loss. Protect the base of the pyramid (grasslands, wetlands, forest understorey) and the top can survive; lose the base and the top collapses regardless of how many laws you write to protect the predators themselves.
The 10% Law also informs food security and dietary planning. A vegetarian diet uses roughly one-tenth the land and water of a meat-based diet for the same calorie intake because animal protein involves an extra trophic step. National Family Health Survey data on nutrition, FAO global hunger reports, and IPCC land-use scenarios all use trophic-efficiency calculations as input. India’s biodiversity policy and the Wildlife Protection Act 1972 implicitly assume this trophic logic when prioritising habitat protection at the base of food webs.
Detailed Analysis: How Energy Moves Through the Pyramid
Energy enters an ecosystem when producers fix solar radiation through photosynthesis. Roughly 0.1 to 1 percent of incoming solar radiation is actually captured as chemical energy in plant tissue; the rest is reflected, absorbed as heat, or used to drive transpiration. This gross primary production (GPP) is reduced by the plant’s own respiration to give net primary production (NPP), which is what is actually available to herbivores.
When a deer eats grass, only a fraction of the grass tissue is ingested, only a fraction of what is ingested is assimilated, and only a fraction of what is assimilated is converted into new deer tissue. The rest is lost as undigested matter (passed as dung, which feeds the detritus food chain), as heat from respiration, and as the energy cost of moving, breathing, and reproducing.
The cumulative effect across four or five trophic levels is why apex predators occupy a tiny share of total ecosystem energy. In Bandipur or Kanha tiger reserves, the standing biomass of tigers is a fraction of one percent of the standing biomass of their ungulate prey, which is itself a fraction of the biomass of grass and trees that feed those ungulates.
The detritus food chain runs in parallel and is often quantitatively larger. Forest floor decomposition recycles dead leaves, faeces, and dead animals through bacteria, fungi, earthworms, termites, and beetles. In a deciduous forest, the detritus food chain may carry 80 percent or more of the total energy flow. This is one reason why protecting soil biota and leaf litter is as important as protecting visible wildlife, a logic the mangrove ecosystem India policy and forest management plans both apply.
Comparative: Three Kinds of Ecological Pyramid
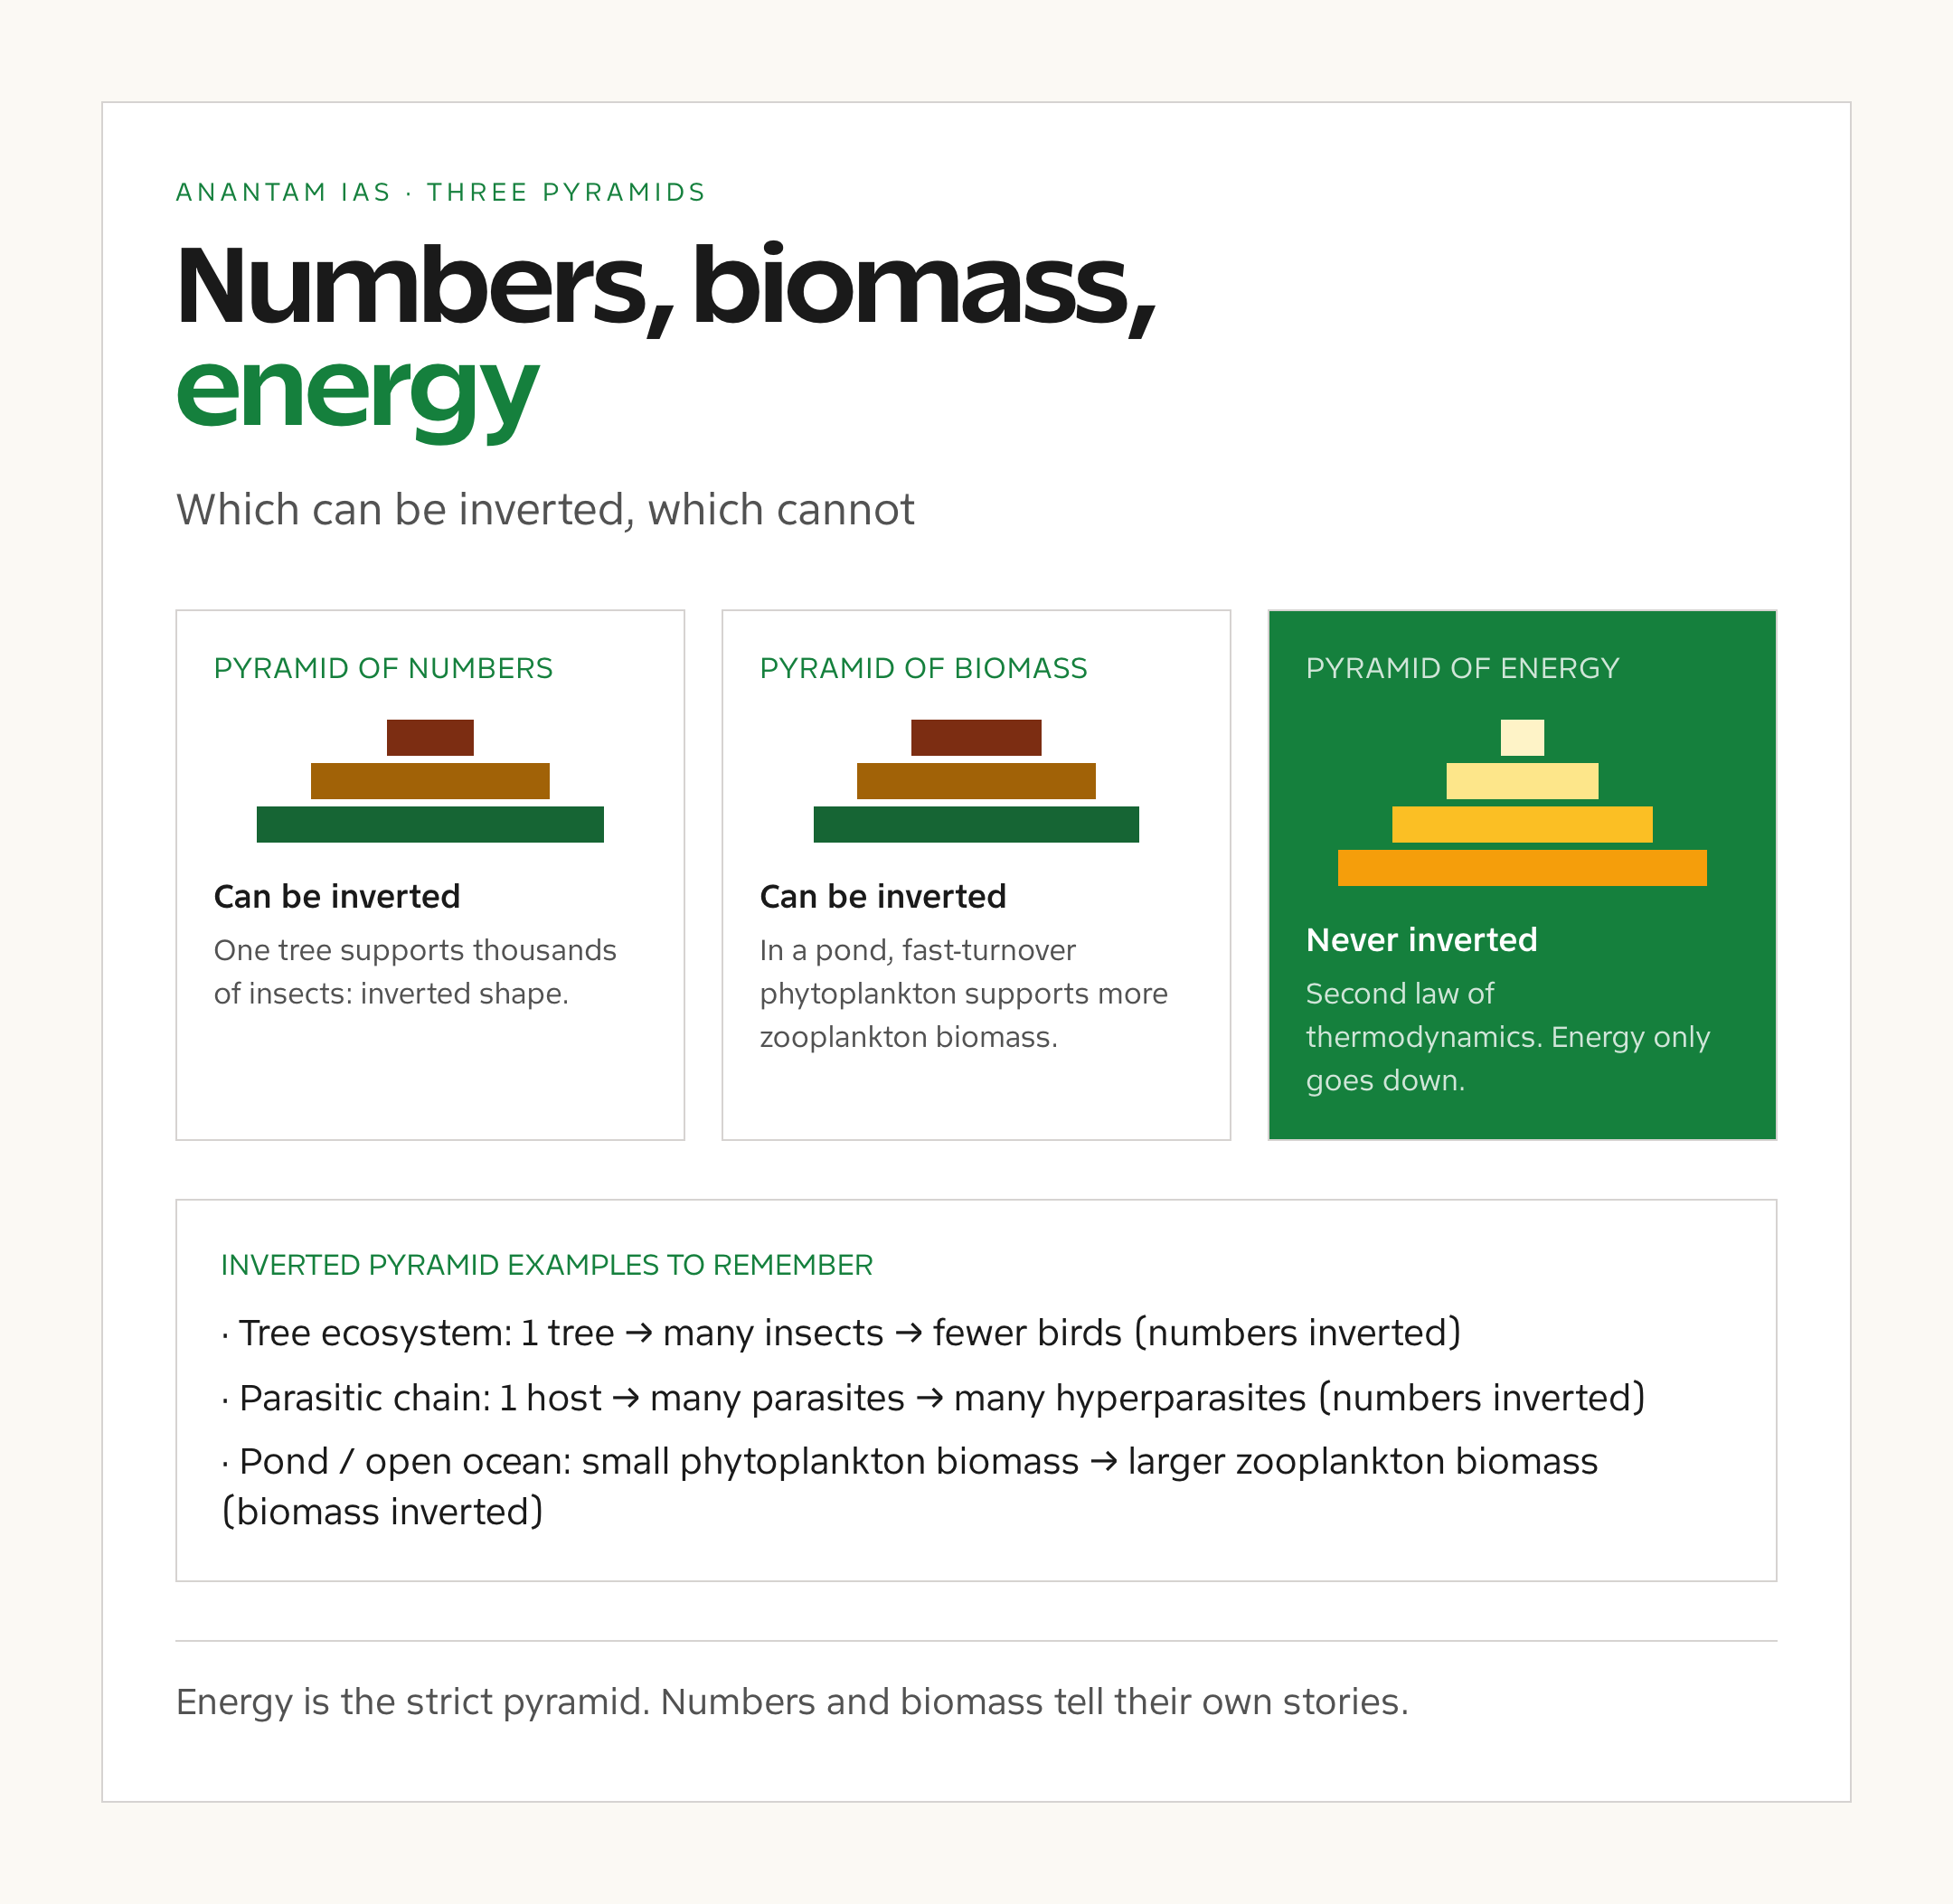
| Pyramid type | What is plotted | Typical shape | Can it be inverted? |
|---|---|---|---|
| Pyramid of energy | Energy flow (kcal/m²/yr) at each level | Always upright | No, energy cannot be created |
| Pyramid of biomass | Standing biomass (g/m²) at each level | Usually upright | Yes, in aquatic ecosystems with fast turnover |
| Pyramid of numbers | Number of individuals at each level | Variable | Yes, when one large producer supports many consumers |
Classic inverted pyramid examples to memorise:
- Inverted pyramid of numbers (tree ecosystem): One large tree (1 producer) supports thousands of herbivorous insects, which support fewer birds, which support fewer hawks. The producer count is smaller than the herbivore count.
- Inverted pyramid of numbers (parasitic chain): A few large hosts support many parasites, which support many more hyperparasites.
- Inverted pyramid of biomass (pond ecosystem): Phytoplankton turn over very quickly, so their standing biomass at any moment can be smaller than that of the zooplankton feeding on them, even though their total annual energy output is much larger.
Challenges in Applying the Pyramid
- Real ecosystems are food webs, not chains: Animals usually feed at more than one trophic level, blurring neat pyramid edges.
- Trophic efficiencies vary: Cold-blooded ectotherms transfer energy more efficiently than warm-blooded endotherms, so reptile-dominated chains differ from mammal-dominated ones.
- Microbial loops matter: Marine ecosystems route a large fraction of energy through bacteria and dissolved organic matter rather than through visible grazers.
- Climate change shifts efficiencies: Warming oceans appear to be reducing trophic transfer efficiency in some fisheries, a critical concern for food security.
- Human harvesting concentrates at high trophic levels: Commercial fishing typically targets large predators, effectively shortening food chains and disrupting pyramid shape, a phenomenon called “fishing down the food web.”
Prelims Pointers
- The ecological energy pyramid was popularised by the work of Raymond Lindeman in 1942.
- Lindeman’s 10% Law: Only about 10 percent of the energy at one trophic level is transferred to the next.
- The pyramid of energy is always upright; energy cannot increase up the chain.
- The pyramid of biomass can be inverted in aquatic ecosystems where producers turn over very fast.
- The pyramid of numbers can be inverted in tree-based or parasitic food chains.
- Producers are autotrophs (plants, algae, photosynthetic bacteria, chemosynthetic bacteria).
- The detritus food chain runs parallel to the grazing food chain and often carries more energy in terrestrial forests.
- GPP minus respiration equals NPP (net primary production), the energy available to higher trophic levels.
- Energy is measured in kilocalories per square metre per year (kcal/m²/yr).
- Food chains are usually limited to four or five trophic levels because of cumulative energy loss.
Mains Practice Questions
- Explain Lindeman’s 10% Law and its implications for the length of food chains and the conservation of apex predators in Indian ecosystems. (GS Paper III, 250 words)
- Differentiate between the pyramid of numbers, the pyramid of biomass, and the pyramid of energy, with suitable examples of when each can be inverted. (GS Paper III, 250 words)
- Discuss how the concept of trophic-level energy transfer informs decisions on food security, dietary policy, and land-use planning in India. (GS Paper III, 150 words)
- The detritus food chain is often more energetically important than the grazing food chain in terrestrial ecosystems. Comment, with examples from Indian forests. (GS Paper III, 250 words)
Way Forward
The ecological energy pyramid remains the simplest mental model for thinking about biodiversity, food security, and climate adaptation together. India’s biosphere reserve network, tiger reserve conservation, and wetland Ramsar designations all rest on protecting the base of the pyramid. Forest restoration, grassland conservation, and marine protected areas widen the base; pollution control, sustainable harvesting, and prey-base augmentation strengthen the middle; and apex predator recovery becomes possible only when the lower levels are intact. For UPSC aspirants and policymakers alike, the lesson is that energy, not enthusiasm, is the binding constraint on how many tigers, dolphins, and great Indian bustards an ecosystem can hold. Conservation is, at its root, a problem of arithmetic.
Frequently Asked Questions
What is the ecological energy pyramid?
The ecological energy pyramid is a graphical representation of the energy available at each trophic level of an ecosystem, with producers at the base and apex predators at the tip. It always has a wider base than top because energy is lost at every transfer.
What is Lindeman’s 10% Law?
Lindeman’s 10% Law, formulated by Raymond Lindeman in 1942, states that only about 10 percent of the energy at one trophic level is transferred to the next. The remaining 90 percent is lost as heat, undigested matter, and energy used in respiration.
What are the trophic levels in a food chain?
The trophic levels are producers (autotrophs), primary consumers (herbivores), secondary consumers (small carnivores), tertiary consumers (larger carnivores), and apex predators. Decomposers break down dead matter from every level.
Can the pyramid of energy be inverted?
No. The pyramid of energy is always upright because energy cannot be created up the food chain; the second law of thermodynamics guarantees that some energy is lost at every transfer.
Can the pyramid of biomass be inverted?
Yes, in aquatic ecosystems. Phytoplankton turn over very quickly, so at any one moment the standing biomass of the producers can be lower than the biomass of the zooplankton feeding on them, even though annual energy output is much higher at the producer level.
Who developed the concept of ecological pyramids?
Charles Elton introduced the pyramid of numbers in 1927. Raymond Lindeman extended the idea quantitatively in 1942 by measuring energy flow and formulating the 10% Law.
Why are food chains usually short?
Because energy is lost at every trophic transfer, only a small fraction of producer energy reaches the fourth or fifth level. There is simply not enough remaining energy to support a sixth predator, so most food chains stop at four or five steps.
What is the difference between gross and net primary production?
Gross Primary Production (GPP) is the total energy fixed by producers through photosynthesis. Net Primary Production (NPP) is GPP minus the energy used by the producers in their own respiration. NPP is what is available to herbivores.
Why does the detritus food chain matter?
The detritus food chain processes dead organic matter through decomposers and detritivores. In terrestrial forests it often carries more energy than the grazing chain and is essential for nutrient cycling and soil fertility.
How does the ecological energy pyramid relate to conservation?
The pyramid shows that apex predators sit on a thin sliver of available energy. Protecting them requires protecting the base of the pyramid, meaning intact grasslands, wetlands, and forest understorey, so that prey species can flourish and support predator populations.
Tell Google you want more of this.
Add Anantam IAS as a preferred sourceOne tap, and this site shows up more often in your own Top Stories, AI Overviews and AI Mode. Remove it any time.